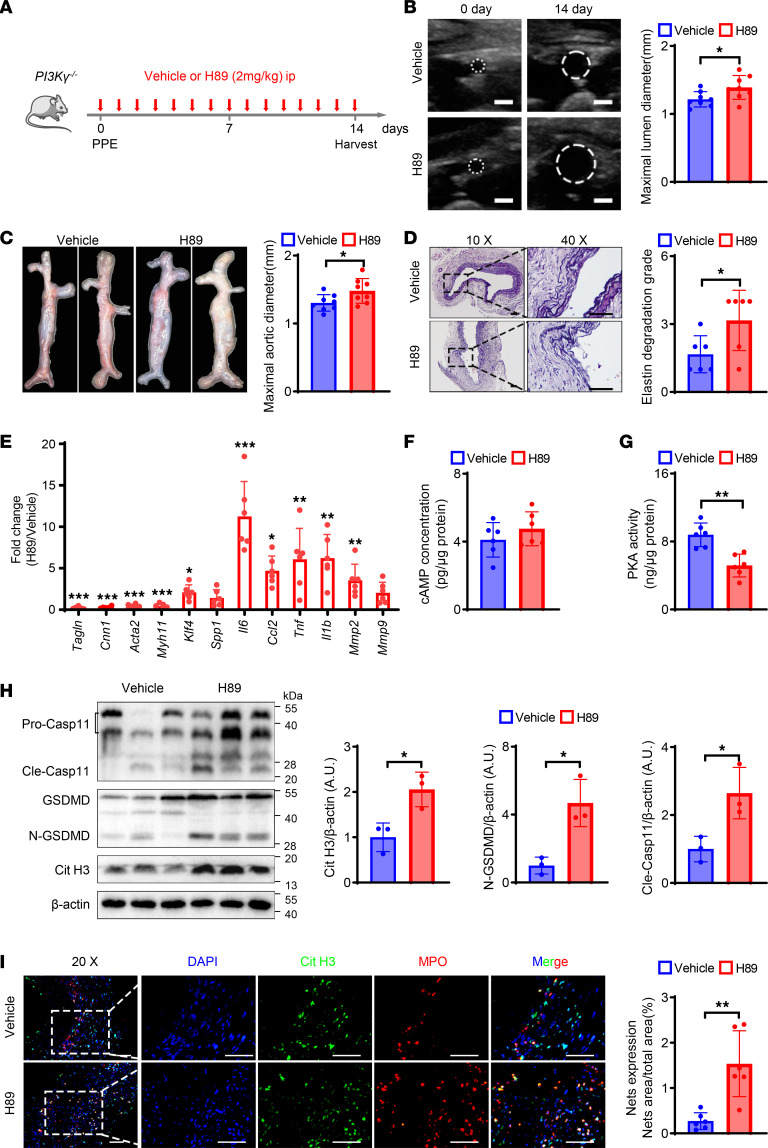
Figure 7. cAMP/PKA inhibitor eliminates protective effect of PI3Kγ knockout in elastase-induced AAA.
(A) Schematic diagram of the animal study to verify the effect of H89 administration in PPE-induced AAA PI3Kγ–/– mice. (B) Representative ultrasound images and quantitative comparison of maximal lumen diameter in PI3Kγ–/– mice after PPE surgery. n = 8. Scale bar: 1 mm. (C) Representative macroscopic images and quantitative comparison of maximal aortic diameter in PI3Kγ–/– mice after PPE surgery. n = 8. (D) Representative VVG staining images and quantitative comparison of VVG staining score in PI3Kγ–/– mice after PPE surgery. n = 6. Scale bars, 50 μm. (E) qPCR analysis of contractile, synthetic, inflammation, and matrix metalloproteinase genes’ expression normalized to the mean expression of housekeeping gene (Actb) in abdominal aorta of PI3Kγ–/– mice from vehicle and H89 administration after PPE-induced AAA. n = 6. (F and G) The concentration of cAMP (F) and PKA activity (G) in the abdominal aorta of PI3Kγ–/– mice. n = 6. (H) Representative Western blot image and quantitative analysis of Cit H3, GSDMD, and caspase-11 protein expression in the abdominal aorta of PI3Kγ–/– mice. n = 3. (I) Representative immunofluorescence staining images and quantitative comparison of NETs in PI3Kγ–/– mouse abdominal aorta after PPE-induced AAA. NETs’ expression was calculated by NET area/total area (%) according to the fluorescence colocalization of DNA (DAPI, blue), citrullinated histone 3 (Cit H3, green), and myeloperoxidase (MPO, red). n = 6. Scale bars, 50 μm. (B–D and F–I) Two-tailed unpaired Student’s t test. (E) Two-way ANOVA followed by Bonferroni’s test. *P < 0.05, **P < 0.01, and ***P < 0.001.

