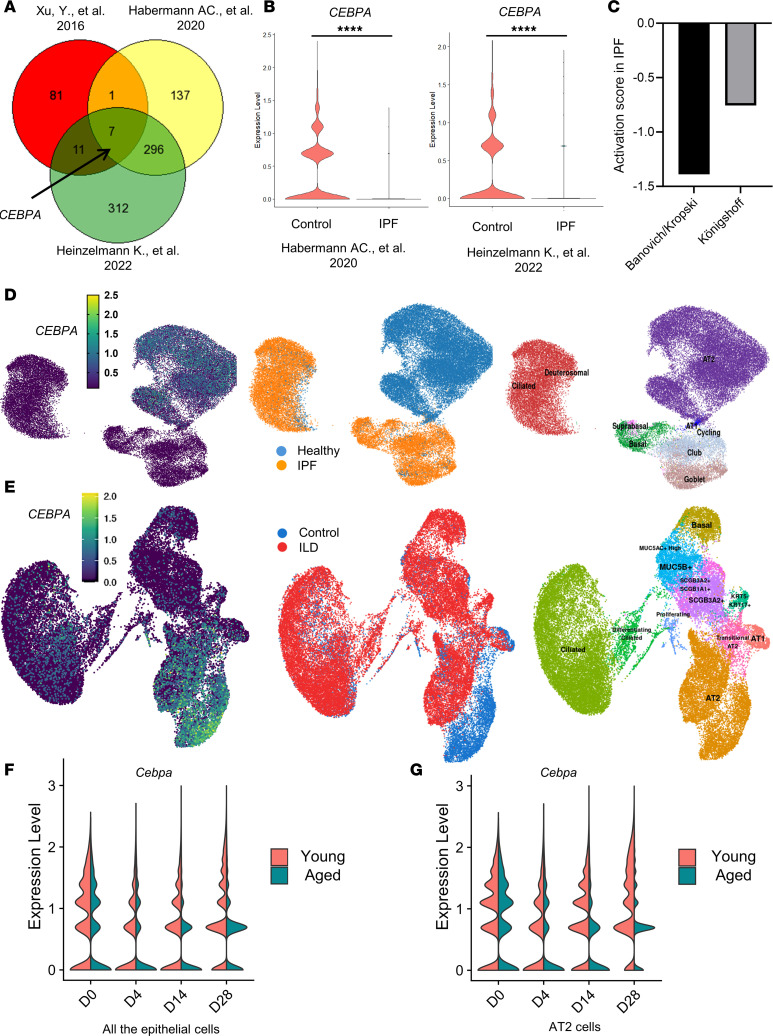
Figure 1. CEBPA is downregulated in human IPF and in experimental lung fibrosis.
(A) In this Venn diagram, each circle represents genes significantly downregulated in human IPF versus control lung samples from each of 3 independent studies. (B) Violin plot of CEBPA expression in epithelial cells from the lungs of patients with and without IPF, from 2 of the human scRNA-Seq data sets analyzed (14, 27). (C) Activation score of Upstream Regulator Analysis (from QIAGEN Ingenuity Pathway Analysis) for the data from the 2 human scRNA-Seq studies in B (14, 27). (D and E) Uniform manifold approximation projection (UMAP) plots of human lung epithelial cells from the 2 scRNA-Seq data sets generated via http://ipfcellatlas.com (F and G) Violin plot of Cebpa expression in the epithelial cells (F) or AT2 cells (G) at different time points (day 0 [D0], D4, D14, D28) after bleomycin injury in the lung of young and aged mice from reanalysis of GSE157995. Data were analyzed using an unpaired, 2-tailed Student’s t test. ****P < 0.0001.

