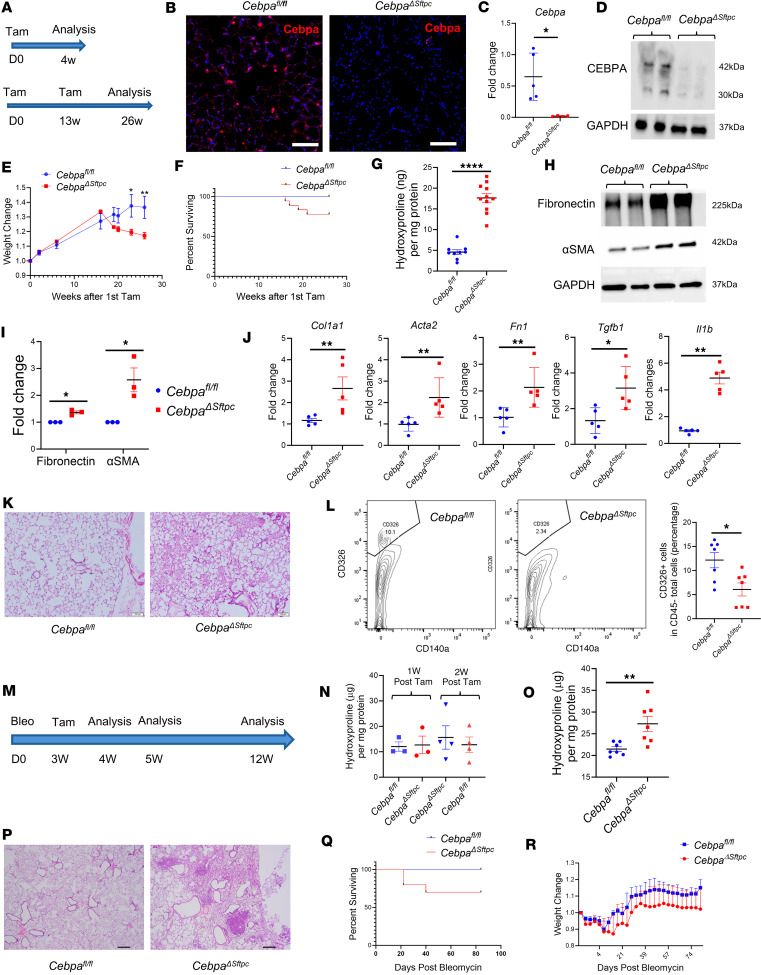
Figure 2. Loss of Cebpa in AT2 cells promotes lung fibrotic response, impairs fibrosis resolution and lung repair.
(A) Schematic showing tamoxifen treatment and analysis timeline. (B–D) Representative immunostaining images (n = 3) of Cebpa expression, qPCR of Cebpa transcripts, and representative Western blot (n = 3) showing Cebpa expression from CebpaΔSftpc and Cebpafl/fl mice lungs, 4 weeks after tamoxifen treatment. Scale bar: 50 μM. (E and F) Weight change of CebpaΔSftpc (n = 14) and Cebpafl/fl (n = 12) mice, and survival curve of CebpaΔSftpc (n = 18) and Cebpafl/fl (n = 10) mice after first tamoxifen treatment, over a 26-week period. (G) Hydroxyproline assay showing collagen deposition from CebpaΔSftpc (n = 11) and Cebpafl/fl (n = 9) mice lungs 26 weeks after first tamoxifen treatment. (H and I) Representative Western blot and their quantification show fibronectin and α-SMA expression from CebpaΔSftpc and Cebpafl/fl mice lungs 26 weeks after tamoxifen treatment. (J) qPCR for profibrotic gene transcripts from CebpaΔSftpc and Cebpafl/fl mice lungs 26 weeks after first tamoxifen treatment. (K) Representative H&E staining showing lung sections from CebpaΔSftpc (n = 3) and Cebpafl/fl (n = 3) mice 26 weeks after first tamoxifen treatment. Scale bar: 100 μM. (L) Flow cytometry analysis of CD326+ cells from CebpaΔSftpc (n = 7) and Cebpafl/fl (n = 7) mice lungs 26 weeks after first tamoxifen treatment. (M) Schematic showing timeline for bleomycin treatment, tamoxifen treatment, and analysis. (N) Hydroxyproline assay from CebpaΔSftpc and Cebpafl/fl mice lungs at 4 and 5 weeks after bleomycin injury. (O) Hydroxyproline assay from CebpaΔSftpc and Cebpafl/fl mice lungs at 12 weeks after bleomycin injury. (P) Representative H&E staining showing lung sections from CebpaΔSftpc (n = 3) and Cebpafl/fl (n = 3) mice at 12 weeks after bleomycin injury. Scale bar: 200 μM. (Q and R) Survival curve and weight change of CebpaΔSftpc (n = 10) and Cebpafl/fl (n = 7) mice over a 12-week postbleomycin injury period. Data were analyzed using a Mann-Whitney U test. *P < 0.05, **P < 0.01, ****P < 0.0001.

