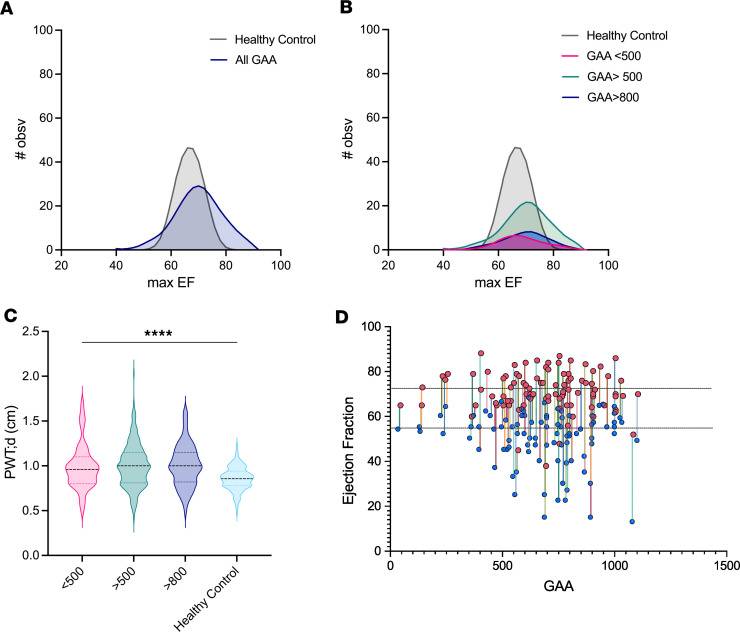
Figure 2. Individuals with higher GAA repeat length are more likely to experience higher maximal EF.
(A and B) Frequency distribution of maximal EFs sorted by GAA (GAA1) repeat length on the shorter allele (n = 315). Curves generated by LOWESS regression with coarse smoothing on frequency distribution of maximum EF (bin size = 2). Simulated healthy control data generated by setting mean and SD with gaussian frequency based on ref. 56. (C) Posterior wall thickness at diastole at maximal EF (n = 315) compared with simulated healthy control data (57). (D) Individual patient EF range recorded throughout 6+ years sorted by GAA repeat length (n = 106). Peak EF is noted with pink circles, and minimum EF is noted with blue circles. Dotted lines represent minimum and maximum observed EFs in adolescents.

