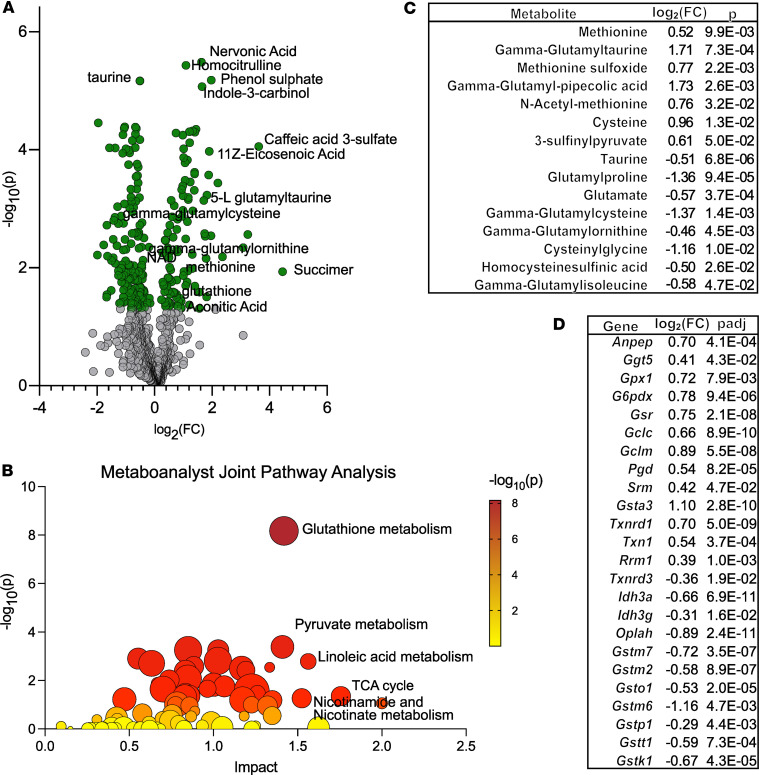
Figure 5. Joint pathway analysis identifies glutathione metabolism as highly affected in shFxn hearts.
(A) Volcano plot indicating significantly depleted and enriched metabolites in shFxn heart tissue (P ≤ 0.05, 2-tailed t test). (B) Metaboanalyst joint pathway analysis using combined transcript data (Padj ≤ 0.05, Wald test, FDR-adjusted) and metabolite data (P ≤ 0.05, 2-tailed t test). (C) Glutathione synthesis–related metabolites modified in shFxn hearts. (D) Glutathione synthesis and function-related genes modified in shFxn hearts.

