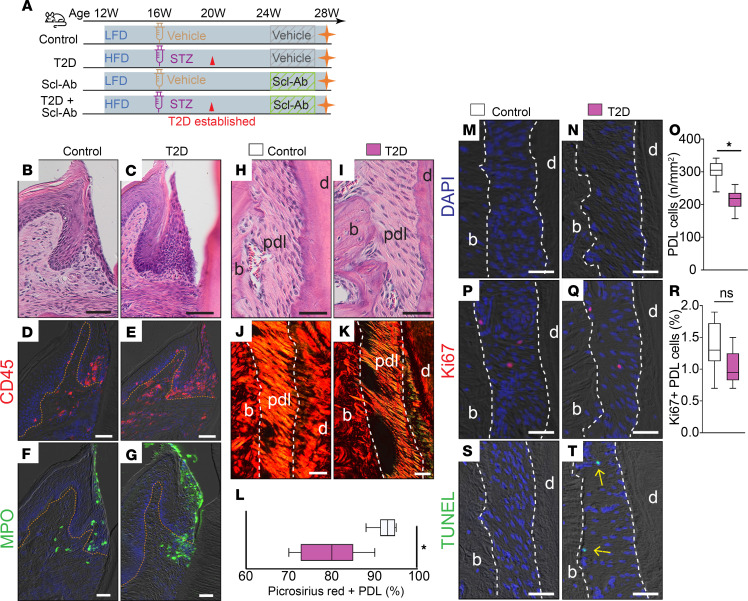
Figure 1. T2D mice displayed elevated gingival inflammation and PDL degeneration.
(A) Schematic of the study design. (B and C) H&E staining shows the gingiva. (D and E) Immunostaining of CD45. (F and G) Immunostaining of the neutrophil marker myeloperoxidase (MPO). The orange dotted lines indicate the boundary between the epithelium and the underlying lamina propria. (H and I) H&E staining shows the PDL. (J and K) Picrosirius red staining, viewed under polarized light. (L) Quantification of the Picrosirius red–positive PDL area (n = 8). *P < 0.01. (M and N) DAPI staining shows cells in the PDL. (O) Quantification of PDL cells from DAPI-stained slides (n = 8). *P < 0.001. (P and Q) Immunostaining of Ki67. (R) Quantification of Ki67+ PDL cells (n = 8). ns, not significant. (S and T) TUNEL staining shows cell apoptosis in the PDL. Yellow arrows indicate TUNEL+ apoptotic PDL cells. The white dashed lines indicate the boundary of PDL. The data were analyzed using the Student’s t test. Scale bar: 50 μm. LFD, low-fat diet; HFD, high-fat diet; STZ, streptozotocin; T2D, type 2 diabetes; Scl-Ab, sclerostin antibody; pdl, periodontal ligament; b, bone; d, dentin.

