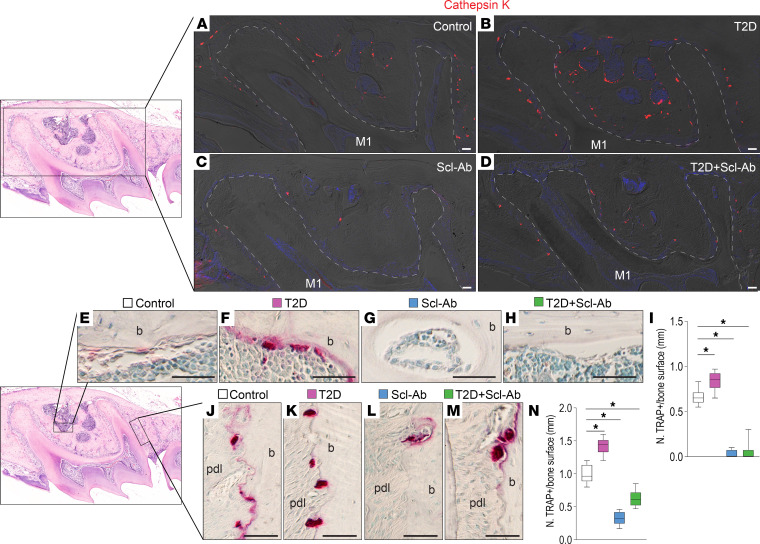
Figure 5. Treatment with Scl-Ab decreases bone resorption.
(A) In the maxillary first molar area, (B–E) immunostaining of cathepsin K shows osteoclasts. Dashed lines indicate the shape of the roots. (F) In the maxillary first molar bone marrow area, (G–J) TRAP staining shows bone resorption. (K) Quantification of TRAP+ cells in the bone marrow area (n = 8). *P < 0.01. (F) On the mesial sides of the periodontal bone surface, (L–O) TRAP staining shows bone resorption. (P) Quantification of TRAP+ cells on the periodontal bone surface (n = 8). *P < 0.0001. The data were analyzed using 1-way ANOVA with Tukey’s post hoc tests. Scale bar: 50 μm. M1, maxillary first molar; pdl, periodontal ligament; b, bone.

