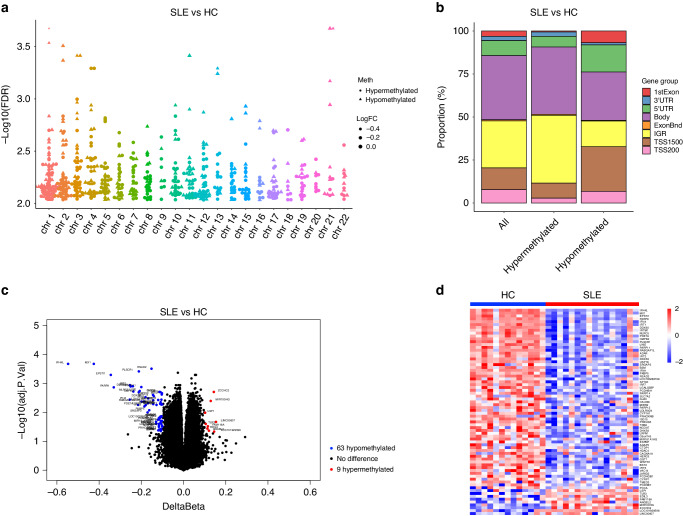
Fig. 1. Identification of differentially methylation genes (DMGs).
a A bar plot illustrating the distribution of DMPs’ locations across the entire genome. b A Manhattan plot displaying the epigenome-wide methylation results, with -log10(adjust p-value) comparison between SLE patients and healthy controls (HC). c A volcano plot showing DMGs between the SLE group and the HC group. Blue and red dots represent 63 hypomethylated and 9 hypermethylated genes in the SLE group. The significance thresholds setting as threshold of an adjust p < 0.05 and |∆β | ≥ 0.1. d A heat map showing DMGs between the SLE group and the HC group. Red color indicates hypermethylation while blue color indicates hypomethylation. Each row and column indicate one DMG and individual sample.

