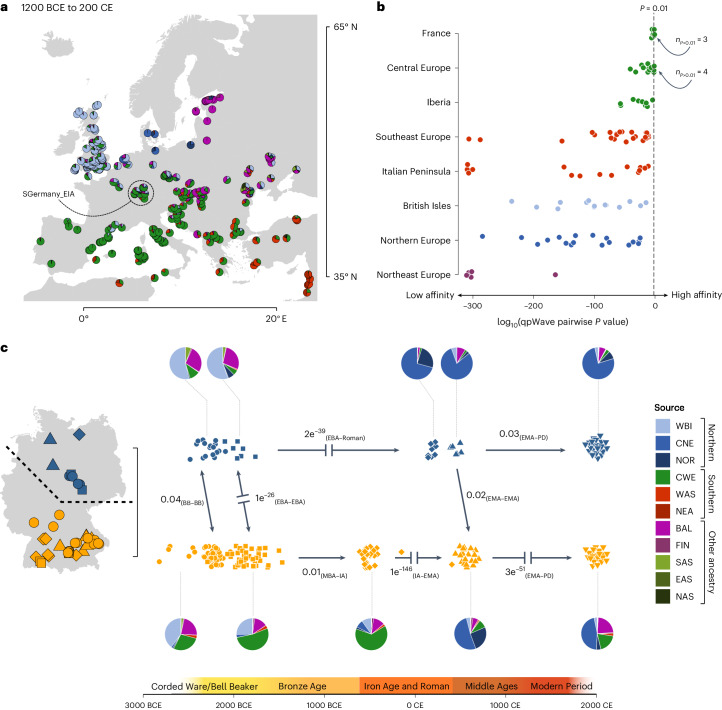
Fig. 4. Population genetic affinities across space and time.
a, Mean supervised ADMIXTURE components at K = 12 (Supplementary Note 4) aggregated across 5,142 individuals from 342 sites dating between 3,150 and 1,750 years BP. b, P values from generalized-likelihood ratio tests implemented in qpWave for testing genetic similarity between southern German Hallstatt individuals and diverse Bronze and Iron Age populations across Europe. Higher P values correspond to higher genetic similarity. c, Overview about population genetic changes in Germany from the Late Neolithic to the present day. The arrows indicate P values from generalized-likelihood ratio tests in qpWave for genetic continuity between temporally preceding and succeeding groups in northern Germany (Lower Saxony, Saxony-Anhalt and Mecklenburg-Vorpommern; symbols in blue) and southern Germany (Baden-Württemberg and Bavaria; symbols in orange), respectively (Supplementary Fig. 5.6). Discontinuities are explicitly marked as interrupted arrows. The pie charts depict the averaged ancestry composition derived from supervised ADMIXTURE (Supplementary Note 4) for each group used in qpWave analysis. The sources are WBI (Britain and Ireland), CNE (North Sea zone), NOR (Scandinavia), CWE (Western Europe and Iberia), WAS (Northern Levant), NEA (Southern Levant, Arabia and North Africa), BAL (Baltics), FIN (Finland), SAS (South Asia), EAS (East Asia) and NAS (North Asia).

