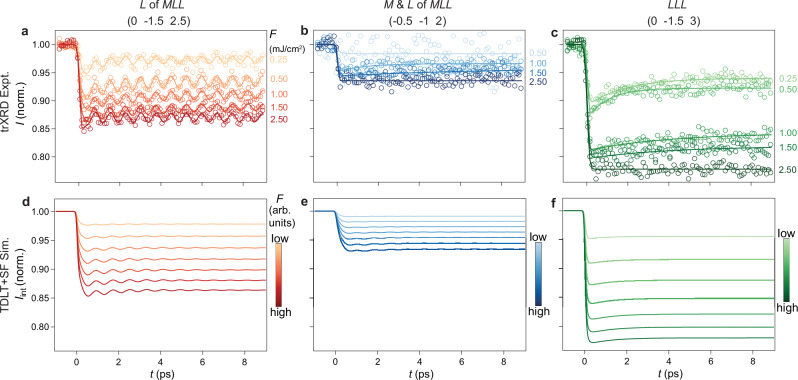
Fig. 2. Dynamics of the CDW peak intensity revealing the coexistence of CDWs.
a–c Temporal evolution of the intensity I obtained by tr-XRD measurements at T = 30 K normalized to the static value for select pump fluences F of CDW peaks at (0 -1.5 2.5), (-0.5 -1 2), and (0 -1.5 3), respectively. Solid lines in panel (a) are fits to a single damped oscillation atop a single exponential decay, while solid lines in panels (b, c) are fits to a single exponential decay (Methods). d–f Temporal evolution of the normalized integrated intensity Iint obtained by simulations based on a combination of time-dependent Landau theory (TDLT) and structural factor (SF) calculation (Methods). The disparity in penetration depths of the X-ray when measuring different peaks has been considered (Supplementary Note 13). Fluence ranges are identical for all three peaks. The order parameter governing each peak is shown at the top.

