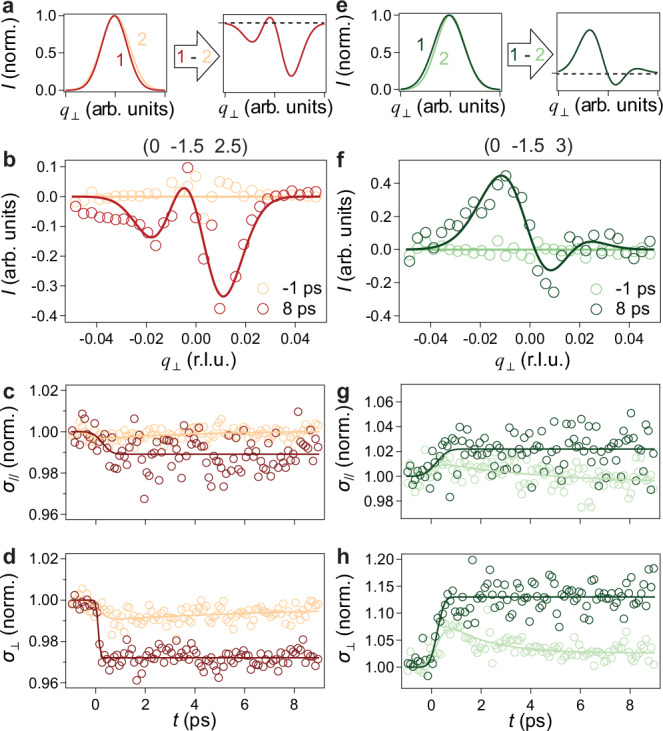
Fig. 3. Dynamics of the CDW peak width revealing the competition between CDWs.

a Schematics of the differential peak-intensity-normalized linecuts along q⊥, which are obtained by subtracting a broader Gaussian from a narrower Gaussian. b Differential peak-intensity-normalized linecuts along q⊥ acquired at t = −1 and t = 8 ps of the peak at (0 -1.5 2.5). Solid lines are fits to zero constant and subtraction of two Gaussians, respectively. c, d Temporal evolution of the (0 -1.5 2.5) peak width along q// and q⊥ directions pumped at F = 0.25 (light orange) and 2.5 mJ/cm2 (dark red) normalized by their equilibrium values. Solid lines are fits to a single exponential decay. e Schematics of the differential peak-intensity-normalized linecuts along q⊥, which are obtained by subtracting a narrower Gaussian from a broader Gaussian. f–h Same plots as panels (b–d) but for the peak at (0 -1.5 3). Lighter and darker green correspond to pumping at F = 0.25 and 2.5 mJ/cm2, respectively. Errors from standard deviation of the Gaussian fitting are about 2.5% and 6.5% for σ// and σ⊥ for both peaks, respectively, which we do not show in the plots for clarity.
