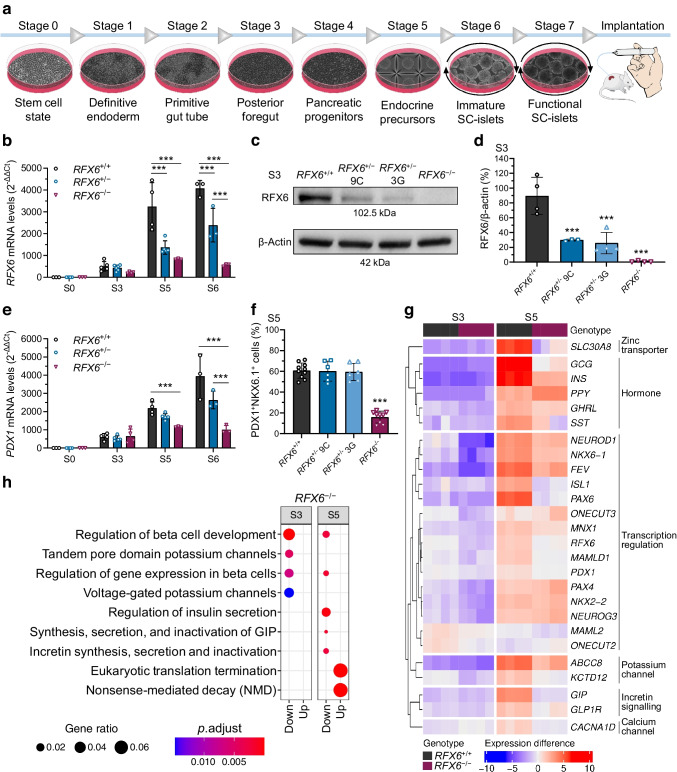
Fig. 2.
RFX6 controls the transcriptional network of pancreatic development. (a) Schematic of H1 SC-islet differentiation protocol. Stages 1–4 in monolayer, stage 5 in microwells and stages 6–7 in suspension culture, followed by implantation under kidney capsule of NSG mice. (b) Relative gene expression levels of RFX6 at stage 0 (S0), S3, S5 and S6 (n=3–5). (c) Protein immunoblots of RFX6 and β-actin for the isogenic H1 clones (9C and 3G) at S3. (d) Percentage of RFX6 protein band densitometry normalised to β-actin bands, quantified from (c) (n=3 or 4). (e) Relative gene expression levels of PDX1 at S0, S3, S5 and S6 (n=3–5). (f) Percentage of PDX1+ and NKX6.1+ cells at S5 measured by flow cytometry (n=6–10). (g) Heatmap showing the relative differences in gene expression of RFX6+/+ and RFX6−/− at S3 and S5 (n=4). Using log1p transformed normalised read count, with sample specific expression subtracted from gene averages. Each gene is differentially expressed in one or both of the stages, FDR<0.01. (h) Enrichment analysis of the differentially expressed genes between RFX6+/+ and RFX6−/− at S3 and S5. The upregulated and downregulated genes (FDR<0.01) were analysed for enrichment against the Reactome database separately for S3 and S5 comparisons. Statistical significance was measured using two-way ANOVA with Tukey’s test for multiple comparisons correction in (b, e), and one-way ANOVA with Tukey’s test for multiple comparisons correction in (d, f). Data are presented as means ± SD; ***p<0.001

