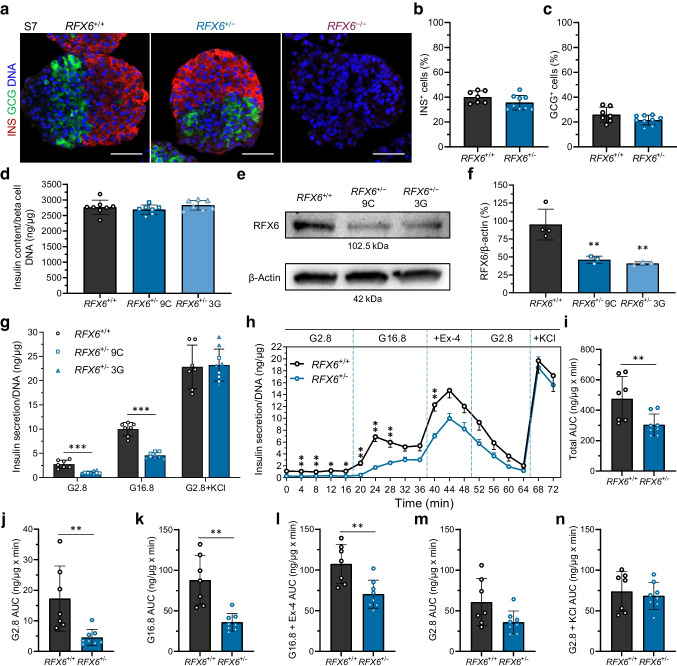
Fig. 4.
RFX6 haploinsufficiency impairs insulin secretion of beta cells. (a) Immunohistochemistry showing insulin-positive (INS+) and glucagon-positive (GCG+) cells for RFX6+/+ and RFX6+/− SC-islets at stage 7 week 2 (S7w2), and for RFX6−/− at stage 7 day 2 (S7d2). Scale bar, 50 µm. (b, c) Percentage of INS+ (b) and GCG+ cells (c) for RFX6+/+ and RFX6+/− SC-islets at S7w2 measured by flow cytometry (n=7–9). (d) Insulin content of RFX6+/+ and RFX6+/− SC-islets at stage 7 week 3 (S7w3) normalised to the DNA content of beta cells (n=7 or 8). (e) Protein immunoblots of RFX6 and β-actin for RFX6+/+ and RFX6+/− SC-islets at S7w2. (f) Percentage of RFX6 protein bands densitometry normalised to β-actin bands, quantified from (e) (n=3 or 4). (g) Static insulin secretion at S7w3 at low 2.8 mmol/l glucose (G2.8), followed by high 16.8 mmol/l glucose (G16.8) and then depolarisation with G2.8+30 mmol/l KCl, normalised to the DNA content of the SC-islets (n=7–9). (h) Dynamic insulin secretion responses to perifusion (4 min intervals) with G2.8, G16.8, G16.8+12 nmol/l exendin-4 (Ex-4) and G2.8+30 mmol/l KCl, normalised to the DNA content of the SC-islets (n=7 or 8). (i) Total AUC, quantified from (h) (n=7 or 8). (j–n) AUC for individual phases, quantified from (h) (n=7 or 8). Statistical significance was measured using unpaired t test in (b, c, i–n), using one-way ANOVA with Tukey’s test for multiple comparisons correction in (d, f) and using two-tailed unpaired multiple t tests in (g, h). Data are presented as means ± SD; *p<0.05, **p<0.01, ***p<0.001

