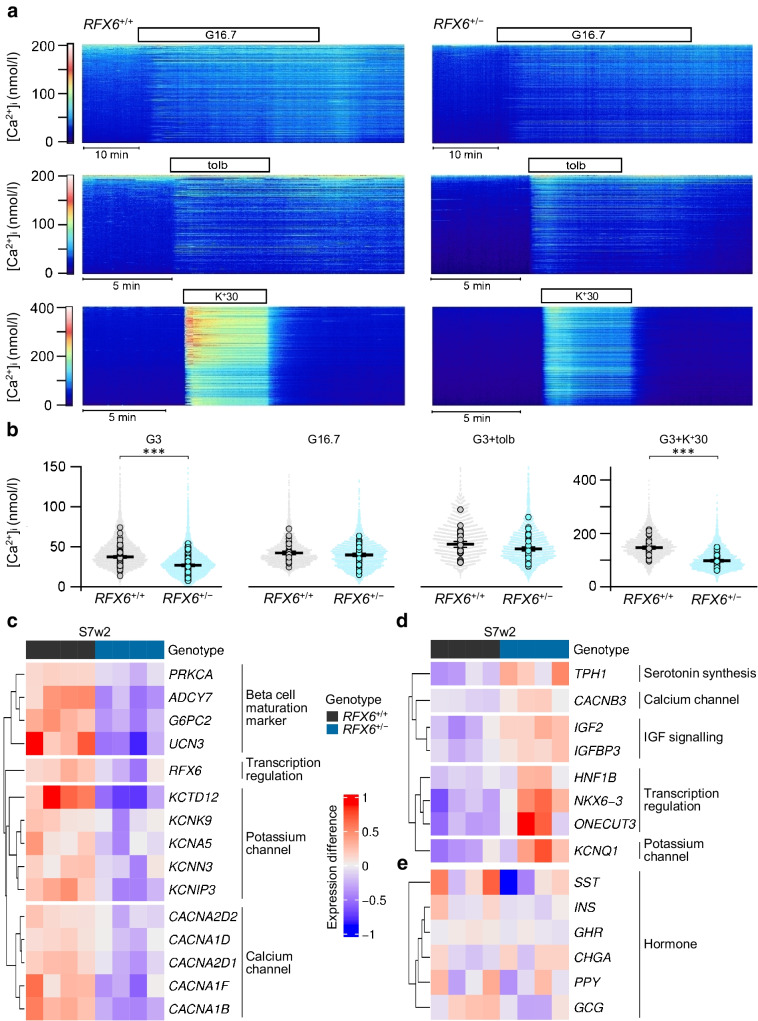
Fig. 5.
Reduced [Ca2+]i in basal and depolarised conditions in RFX6+/− SC-islets. (a) Heatmaps of [Ca2+]i recorded with Fura-2 LR in cells within SC-islets under basal conditions of 3 mmol/l glucose (G3) and after stimulation with 16.7 mmol/l glucose (G16.7), G3+1 mmol/l tolbutamide (tolb) and G3+30 mmol/l K+ (K+30). Each heatmap shows the responses of all cells in one islet. (b) Quantification of [Ca2+]i responses from experiments as in (a). Time-averaged [Ca2+]i for all individual cells (dots) and average values for all cells in each islet (circles). The bars represent means ± SEM for the averaged islet responses. n=no. of islets (total cell number in parenthesis): G3 WT, n=65 (6933); G3 RFX6+/−, n=75 (8502); G16.7 WT, n=29 (3203); G16.7 RFX6+/−, n=42 (4853); tolb WT, n=23 (2720); tolb RFX6+/−, n=39 (4692); K+30 WT n=32 (3639); and K+30 RFX6+/−, n=37 (4320). Statistical analyses with Student’s unpaired two-tailed t test, ***p<0.001. (c) Heatmap of downregulated genes in RFX6+/− SC-islets at stage 7 week 2 (S7w2). Statistically significant genes (ADCY7, G6PC2, UCN3, KCTD12, KCNIP3 and CACNA1B), FDR<0.01 (n=4). (d) Heatmap of upregulated genes in RFX6+/− SC-islets at S7w2. All genes except IGFBP3 are statistically significant, FDR<0.01 (n=4). (e) Heatmap of hormone gene expression in RFX6+/+ and RFX6+/− SC-islets at S7w2. None of the genes show statistically significant differences (n=4). Heatmaps (c–e) show log1p transformed normalised read count, with sample-specific expression subtracted from gene averages

