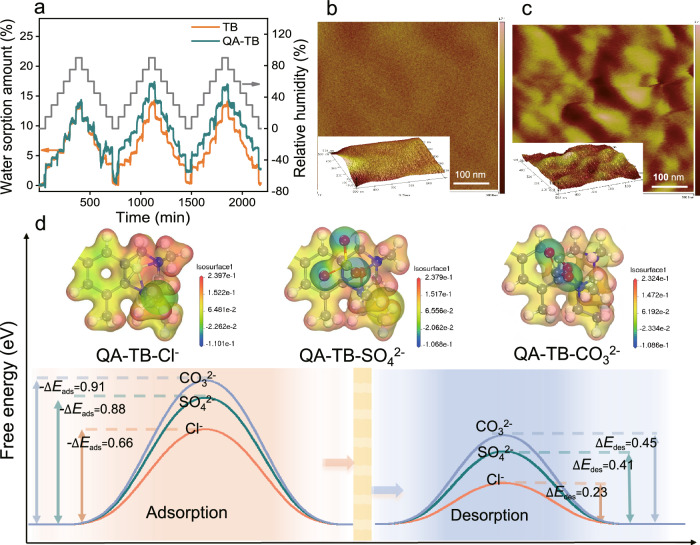
Fig. 6. Anion separation across the ionized sub-nanochannels.
a Water sorption behavior of TB and QA-TB membranes investigated using dynamic vapor sorption (DVS). Atomic force microscopy (AFM) images of the (b) TB membrane and (c) QA-TB membrane. The bright regions in (c) represent the hydrophobic segments of the polymer backbone, whereas the dark regions correspond to the hydrophilic portions of the QA groups. The partitioning calculation using ImageJ software reveals that the percentage of hydrophilic region is about 22.71% and the percentage of hydrophobic region is about 77.29%. d Electrostatic potential diagrams and calculations of adsorption and desorption energies for Cl-/SO4²⁻/CO3²⁻ on the surface of QA-TB. The CO32- exhibits greater negative adsorption energy, indicating stronger adsorption to QA-TB, and has higher desorption energy, hindering desorption. Conversely, Cl- shows the lowest free energy, resulting in faster migration.

