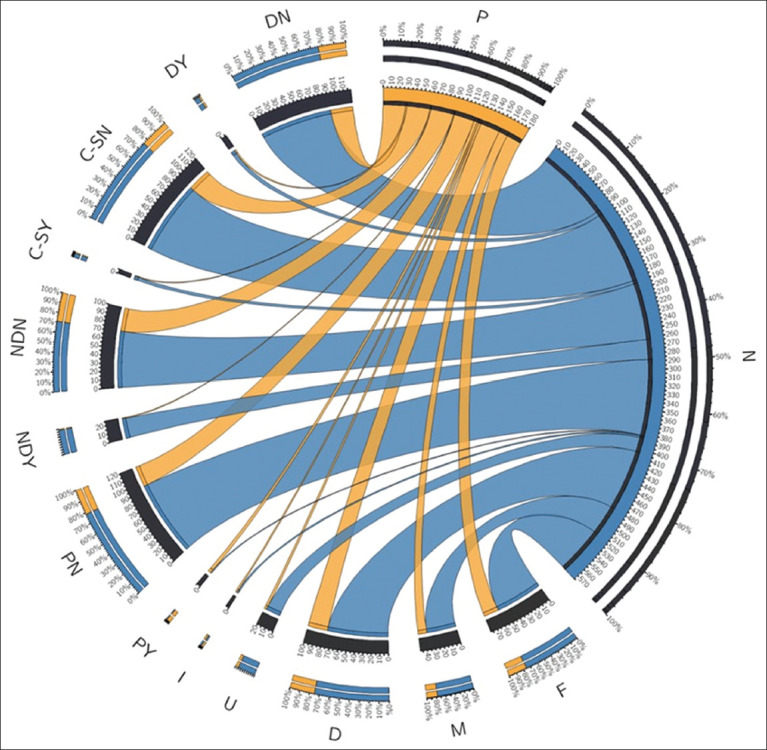
Figure-1.

Graphical representation of the clinical conditions and quantitative results of the animals studied. The graph contains the quantitative results of the infected cats (P=Positive and N=Negative). F (P = 19; N = 59) and M (P = 11; N = 37) represent female and male sex, respectively (D=Docile; P = 25; N = 76), (U=Unsociable; P = 3; N = 18), and (I=Indifferent; P = 2; N = 2) represent feline behavior, only participants who knew the brands of vaccines they had taken. (PY=Confirmed pregnancy; P = 4; N = 1) and (PN=No pregnancy; P = 26; N = 95) represent pregnant or not pregnant females. Regarding the cats that had nasal discharge, we represented NDY (P = 1; N = 25) as cats with nasal discharge and NDN (P = 29; N=71) as cats without nasal discharge. For cats that presented with cough/sneeze, we represented them as C-SY (P = 1; N = 4) and those without Cough/Sneeze as C-SN (P = 29; N = 92). In addition, we assessed dyspnea, considering DY (P = 2; N = 5) as the cats that had dyspnea and DN (P = 28; N = 91) that did not.
