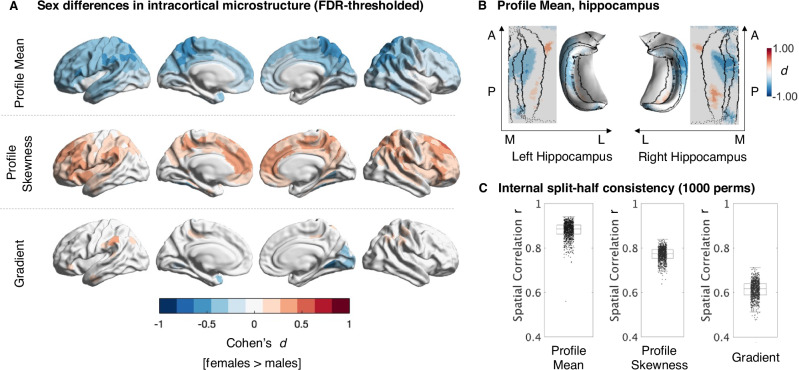
Fig. 2. Sex differences in the brain’s microstructural organization.
A FDR-thresholded Cohen’s d maps showing significant sex differences (females (n = 594) > males (n = 499)) in intracortical microstructure: T1w/T2w based intracortical profile mean, profile skewness, and the microstructural gradient. Red colors represent microstructural values higher for females, blue represent values higher for males. B 2D and 3D FDR thresholded Cohen’s d maps of the unfolded hippocampus showing significant differences in T1w/T2w mean between females (n = 500) and males (n = 367 male). C Boxplots represent Pearson’s r-values between unthresholded t-statistics resulting from two respective split-halves of the sample (n = 1000 permutations) comparing profile mean, profile skewness, and microstructural gradient between females and males, indicating the reliability of each measure. The median is shown as the central mark, the box indicates the 25th and 75th percentile; whiskers include all values not considered outliers (1.5*IQR from the quartile). Source data are provided as a Source Data file.

