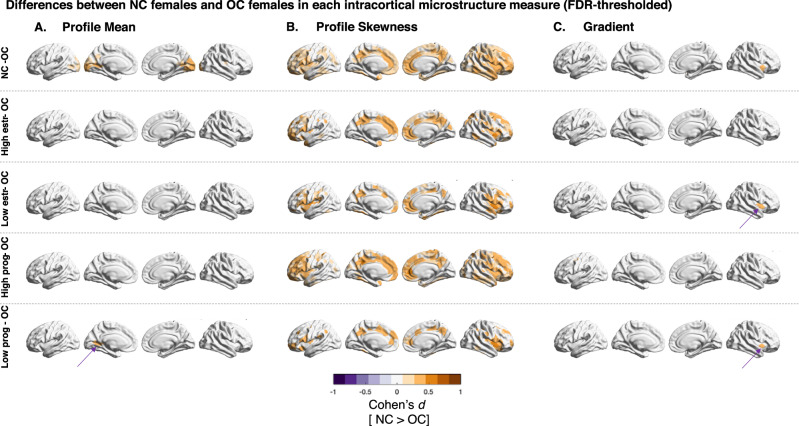
Fig. 4. Differences between NC females and OC females for each intracortical measure.
FDR-Thresholded Cohen’s d for microstructural differences between female groups, comparing OC females with all NC females (n = 284), as well as OC females (n = 170) with specific NC subgroups, divided by hormone estimations according to self-reported days after menstruation (nlow estrogen = 100; nlow progesterone = 171; nhigh estrogen = 184; nhigh progesterone = 113). Columns are the three microstructural measures T1w/T2w mean (A), T1w/T2w skewness (B), and the microstructural gradient (C). Purple areas are parcels which had significantly higher values in OC females, orange shows significantly higher values for NC females after FDR-thresholding (all Cohen’s d). OC oral contraceptives, NC naturally cycling, prog progesterone, estr estrogen. Source data are provided as a Source Data file.

