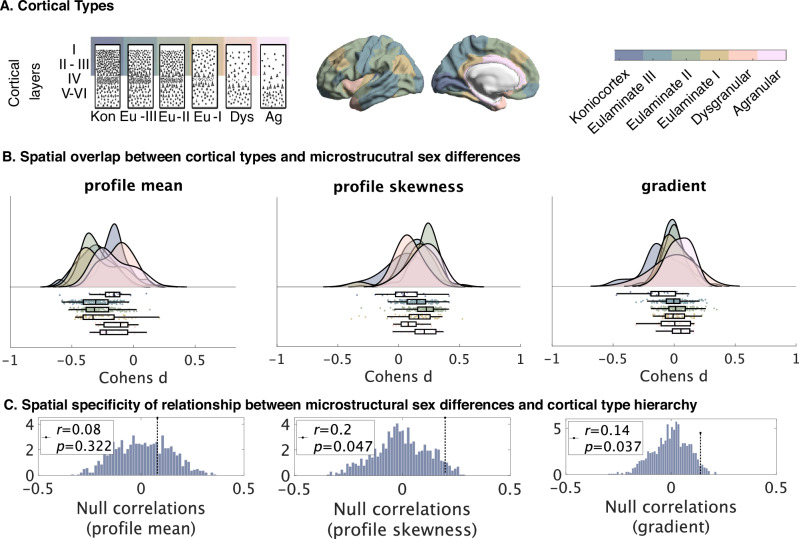
Fig. 6. Contextualization of effects by histological decoding.
A Schematic of cortical types according to von Economo and Koskinas and Garcia-Cabezas14,17,131. B Results were put into context by spatial correlations with a hierarchy of laminar differentiation (cortical types). Figures show links between cortical type hierarchy and effect values (Cohen’s d for each of the 400 parcels) for each of the T1w/T2w profile-based intracortical measures. Raincloud plots135 show distribution of sex-difference effects per parcel, binned by cortical type. Also binned by cortical type, boxes show the median and interquartile (25–75%) range of the respective distribution of sex-difference effects, whiskers depict the 1.5*IQR from the quartile. C Zero-distributions between random hierarchies and effect maps in comparison to the statistical r-value (one-sided). Profile skewness and gradient correlate significantly with histological hierarchy according to spatial autocorrelation significance level; profile mean does not. Kon koniocortex, EU-III Eulaminate III, EU-II Eulaminate II, Eu-I Eulaminate I, Dys Dysgranular, Ag Agranular. Source data are provided as a Source Data file.

