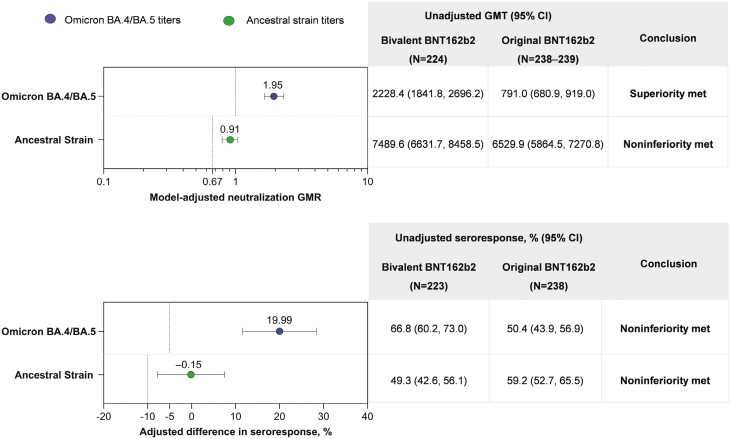
Figure 1.
(A) Model-adjusted GMRs and unadjusted GMTs and (B) adjusted differences in percentages of participants with seroresponses 1 month after bivalent BNT162b2 (dose 4) and original BNT162b2 (dose 3) in participants 6 months to <5 years of age. Data are for the per-protocol set of the evaluable immunogenicity population (see Supplementary Table 2) and include participants with and without evidence of previous SARS-CoV-2 infection. Data for original BNT162b2 are in participants from the original pediatric study (NCT04816643) who were matched by age, baseline SARS-CoV-2 status, and time since previous BNT162b2 dose (see Table 1 for demographic details for these participants and those of the evaluable immunogenicity population of the current study). Shown in (A) are model-adjusted GMRs (95% CIs) of the vaccine comparison (graph) and associated unadjusted GMTs (table). Assay results below the LLOQ were set to 0.5 × LLOQ. Shown in (B) are the adjusted differences in percentages (95% CIs) of participants with Omicron BA.4/BA.5 and ancestral strain seroresponses and associated unadjusted seroresponse rates. Dotted lines represent superiority or noninferiority criteria for each comparison. Omicron BA.4/BA.5 neutralizing titer superiority was defined as a lower bound of the GMR 95% CI of >1; noninferiority of seroresponse was defined as lower bound of the 95% CI for the percentage difference in seroresponse of > −5%. Noninferiority criteria for the ancestral strain were a lower bound of neutralizing titer GMR 95% CI of >0.67 (and GMR point estimate ≥0.8) and a lower bound of the 95% CI for the percentage difference in seroresponse of > −10%. GMR, geometric mean ratio; GMT, geometric mean titer; LLOQ, lower limit of quantitation.

