Figure 3.

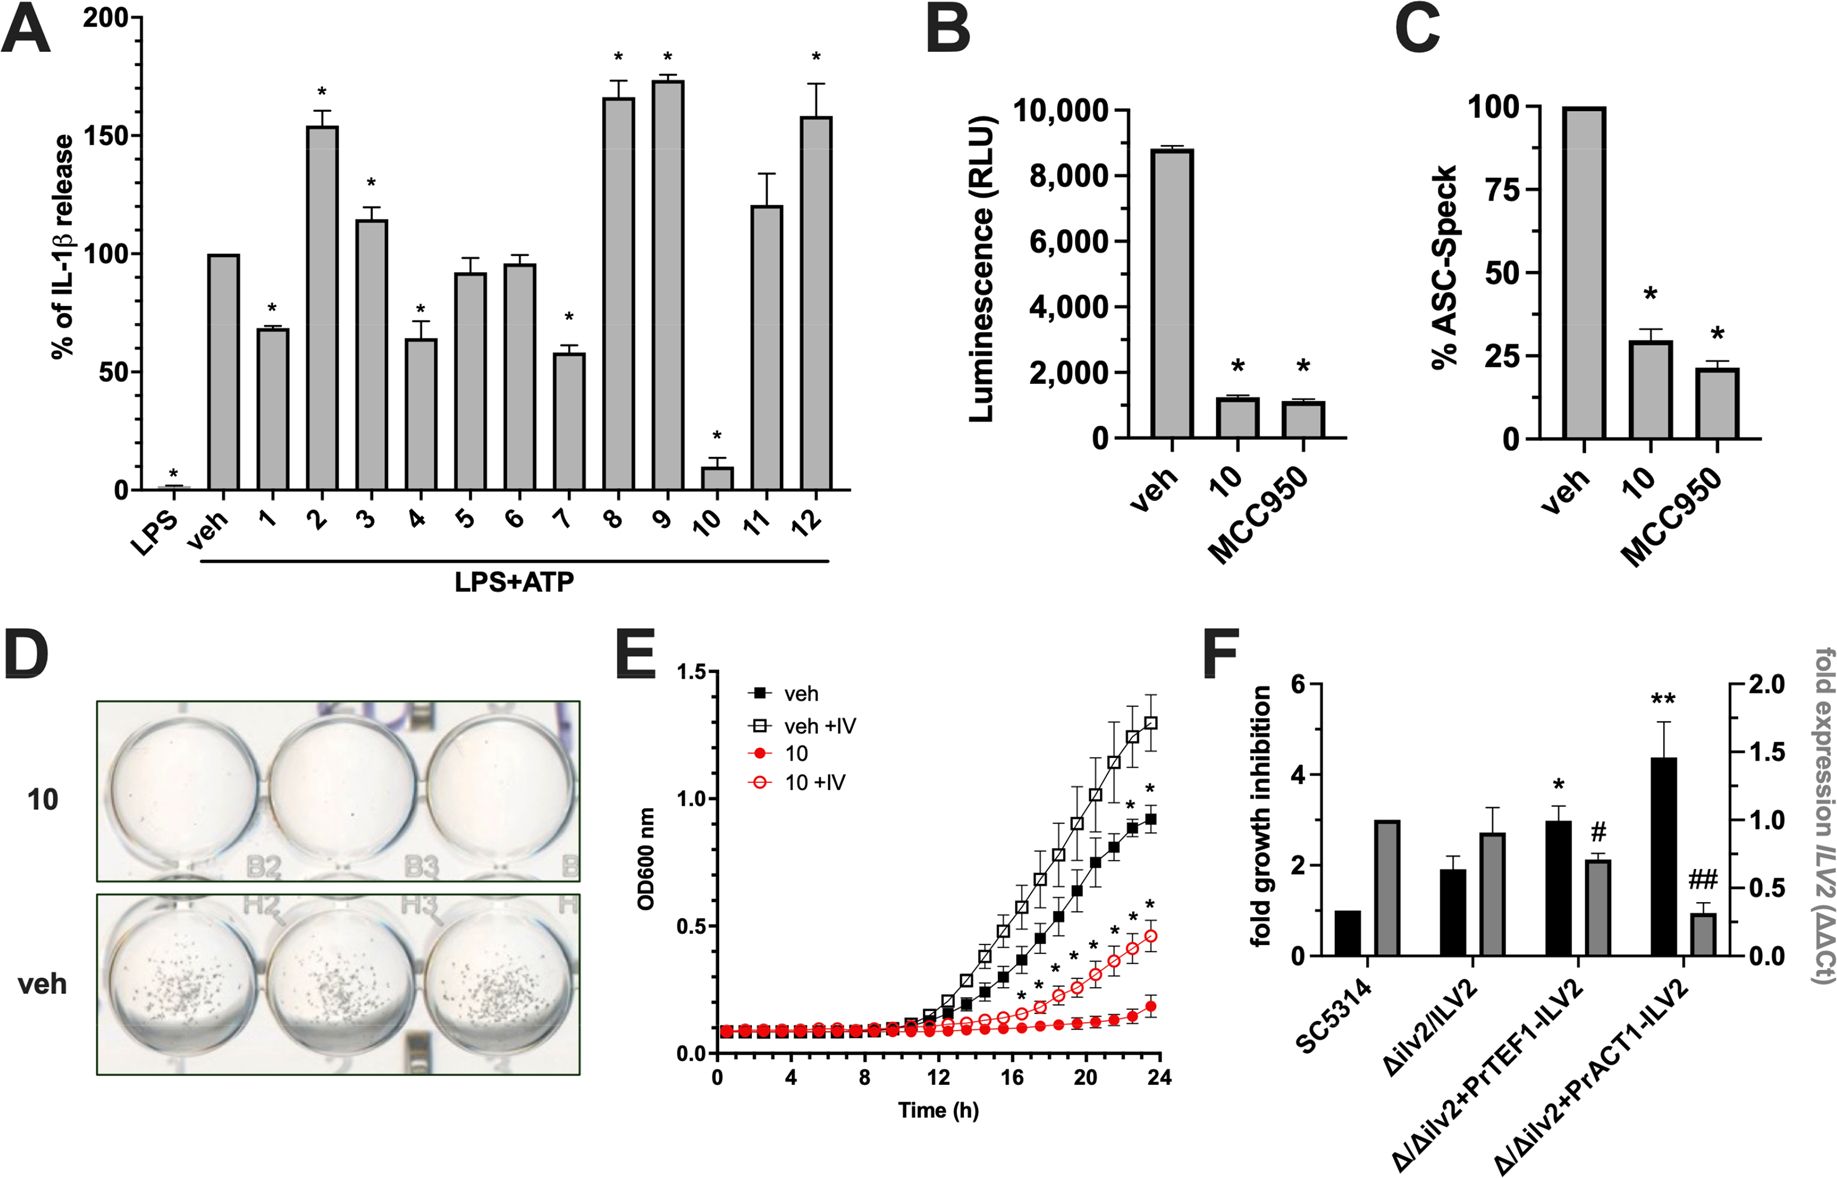
Compound 10 identified by molecular docking possesses both anti-inflammasome and antifungal activity. (A) THP1 cells were treated with 50 μM of each lead compound or vehicle alone (0.5% DMSO) for 1 h, followed by 20 ng of LPS for 3.5 h, and then 5 mM ATP for 30 min where indicated. IL-1β was measured by ELISA. (B) THP1 cells were used as described in panel A and treated with vehicle, 50 μM compound 10, or 0.1 μM MCC950. Processed Caspase-1 was measured by bioluminescence assay and values expressed as relative light units (RLU). (C) ASC-Speck GFP reporter cells were used and treated as described in panel B. The number of GFP+ Specks were enumerated in 10 random fields and calculated as percentage of the vehicle control. Cell culture experiments were conducted in technical quadruplicate (or duplicate for imaging) and results reported as the mean plus SD from independent experiments (n = 3). * indicates p < 0.05 using one-way ANOVA and Dunnet’s post-test. (D) A growth assay was performed by growing 2.5 × 10³ C. albicans cells in YNB without amino acids for 24 h supplemented with 50 μM compound 10 or vehicle only. Images were captured on a digital scanner and are representative of 3 independent experiments. (E) Growth curves were conducted and OD600 nm monitored kinetically at 30 °C for 24 h in YNB media without (closed shapes) and with (open shapes) 10 mM each isoleucine and valine in the presence (red) or absence (black) of 50 μM compound 10. Experiments were conducted in biological triplicate and reported as mean plus SD * indicates p < 0.05 using multiple t test and Holm-Sidak post-test. (F) WT (SC5314) or genetically altered strains with respect to C. albicans AHAS expression (Δilv2/ILV2, Δ/Δilv2+PrTEF1-ILV2, Δ/Δilv2+PrACT1-ILV2) were grown in vehicle or 50 μM compound 10. Percent growth inhibition was calculated for each strain and normalized to WT values (black bars, left y-axis). Expression levels of ILV2 were assessed for each strain at the same time point using qRT-PCR (gray bars, right y-axis). Values were calculated using the ΔΔCT method by comparing to the housekeeping gene ACT1 and strain SC5314. Experiments were conducted in biological triplicate and reported as mean plus SD *, # p < 0.05, **, ## p < 0.01 using one-way ANOVA and Dunnett’s post-test.
