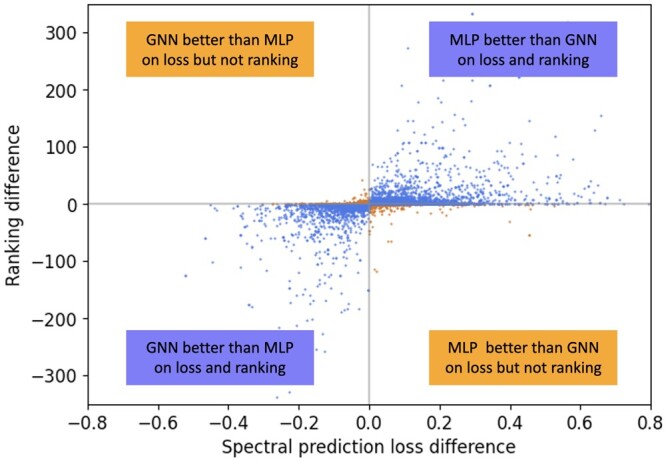
Figure 3.

Spectral loss difference (x-axis) versus rank difference (y-axis) between MLP-PD and GNN-PD results for test set molecules. Spectral prediction loss is computed using the negative cosine similarity between measured and predicted spectra. Candidate ranking performance is the rank of target molecule per each model. The rank and loss difference metrics are in agreement in some cases (points in the upper right and lower left quadrants), but there are cases of disagreement (points in upper left and lower right quadrants).
