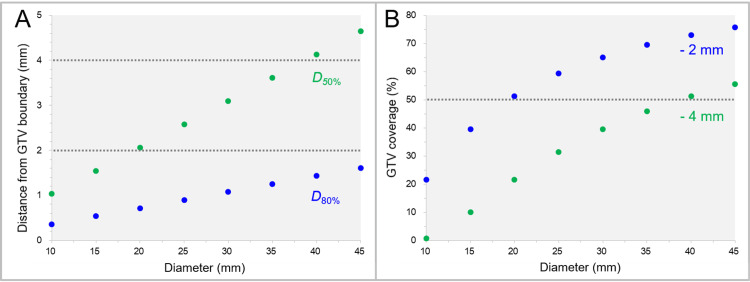
Figure 1. Distances of the irradiated isodose volume surfaces of spherical GTV D80% and D50% from the GTV boundary, and the GTV coverages by the 2 mm and 4 mm inner volumes of the GTV.
The scatter plots show the correlations between the spherical GTV diameters and the distances of the irradiated isodose volume surfaces of the GTV D80% and D50% from the GTV boundary (A) and the GTV coverage values by the GTV - 2 mm and GTV - 4 mm structures (B). All the structure volumes are based on calculations.
GTV: Gross tumor volume; DX%: A minimum dose to cover X% of a target volume; GTV - X mm: Gross tumor volume evenly reduced by X mm

