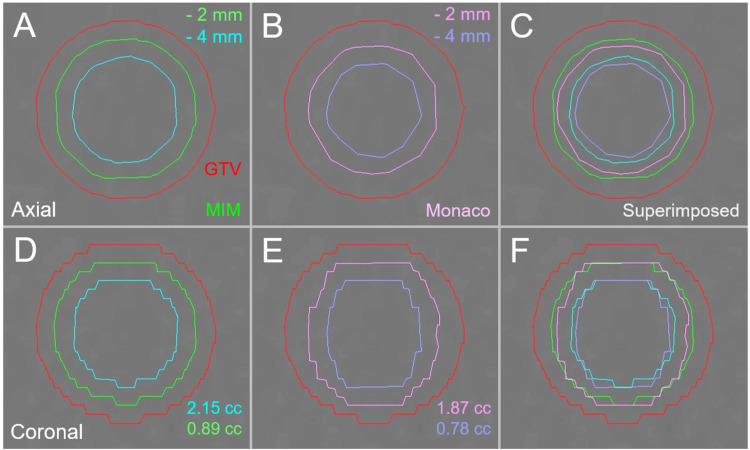
Figure 3. The differences in functions to reduce volume evenly between two planning systems in a 20-mm sphere model.
The images show the target contours superimposed onto non-contrast-enhanced (CT) images (A-F); axial images (A-C); coronal images (D-F); by MIM Maestro (A and D); by Monaco (B and E); and the superimposed images (C and F).
The differences in the volumes are equally reduced by 2 mm and 4 mm from the identical spherical model with a diameter of 20 mm.
CT: Computed tomography; GTV: Gross tumor volume; GTV - X mm: Gross tumor volume evenly reduced by X mm; MIM: MIM Maestro

