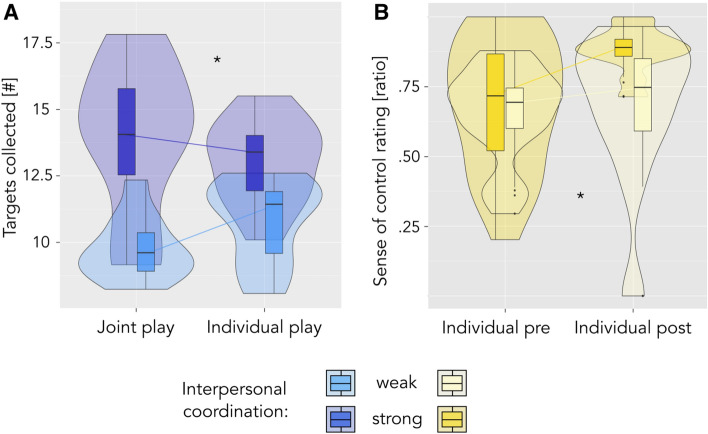
Figure 6.
Players from strongly versus weakly coordinated teams at the shift from joint to individual play. Plots display interaction effects of coordination level (strong versus weak) and time. Significant effects are indicated by ** (p < .01) and * (p < .05). (A) Players from highly coordinated pairs collect fewer targets in the final period of individual play compared to their joint play performance in the second session—the opposite holds for players from weakly coordinated pairs. (B) The sense of ball control increases more strongly from the first to the last 10 trials of individual play for players from strongly coordinated pairs.

