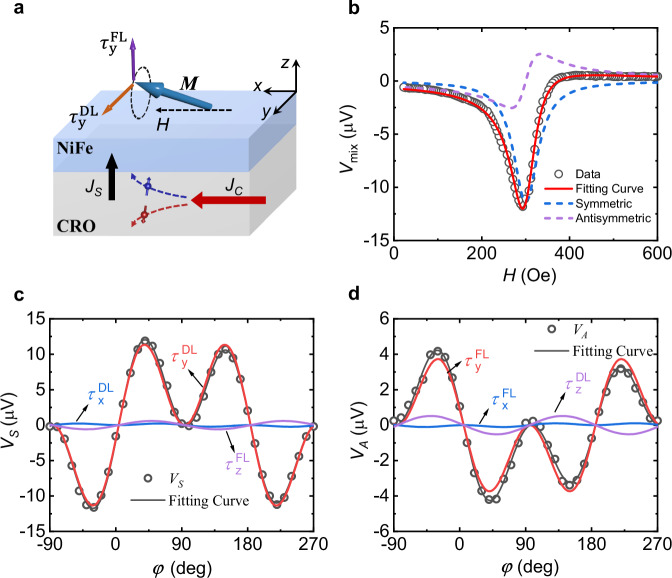
Fig. 3. ST-FMR measurement.
a Schematic of ST-FMR measurement. A radio frequency charge current Jc with a frequency of 5 GHz and power of 15 dBm is applied to the device, which induces an alternating spin current Js due to the spin Hall effect. The spin current then flows into the adjacent Py layer and exerts a torque on the magnetization. The mixing voltage is measured by using lock-in amplifier. b ST-FMR spectra of the Py/CRO device at 300 K. The external magnetic field is oriented at φ = ‒45° with respect to the charge current direction. Black circles denote the measured raw data. Red solid lines are the fitting curves, which are composed of the symmetric (blue short dashed) and antisymmetric (purple short dashed) components. c, d Symmetric and antisymmetric voltage amplitudes depending on applied field angle for Py/CRO device. Black circles indicate the extracted values from ST-FMR measurement. The red, blue, and purple curves represent the calculations of τx, τy, and τz, respectively, from the analyses using Eqs. (1) and (2).

