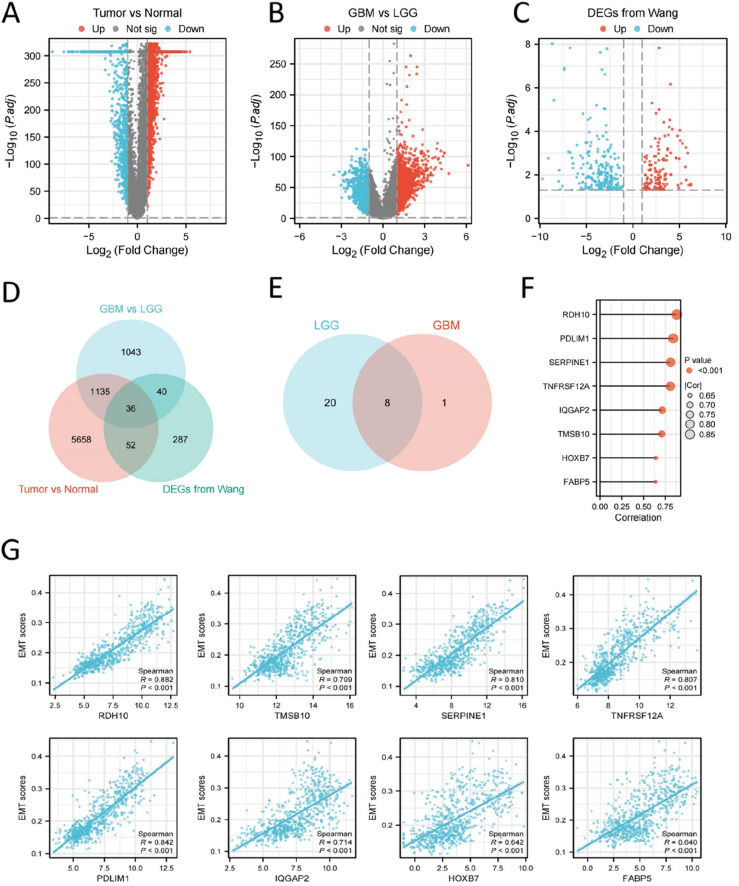
Figure 3.
Identification of DEGs in glioma. (A) DEGs between glioma and normal brain tissue from TCGA and GTEx database. (B) DEGs between GBM and LGG in TCGA database. (C) DEGs between HSCG and LSCG from a previous study. (D) Venn diagram showed the intersected DEGs of 3 analytic methods, 36 genes in total. (E) Venn diagram showed the intersection of prognosis-related genes in LGG and GBM, a total of 8 genes. (F-G) Bar plot and scatter plot showed the correlation between the 8 genes and EMT scores in TCGA glioma.

