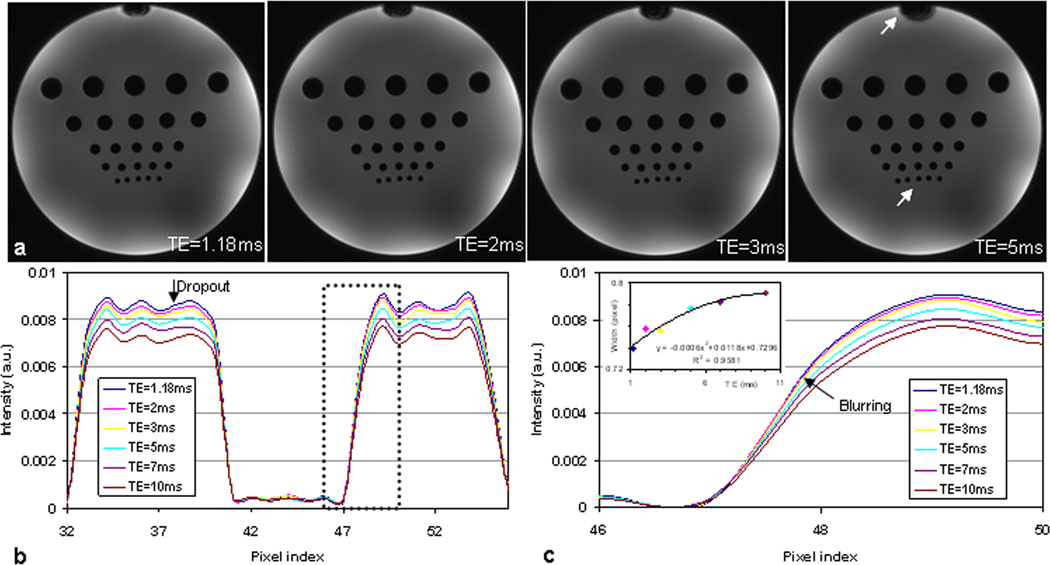
Fig. 2.
a) Spiral images of a phantom for showing development of signal dropout and image blurring (arrows) with TE increasing. (FOV=220mm, matrix size=256, , TR=100ms, slice thickness=5mm, and spirals=64 for a readout of 3.52ms).
b) Intensity profiles through the centers of the dark holes in the last row [arrow in a)] for illustrating signal dropout with TE increasing.
c) Zoom-in [dashed box in b)] display around the edge of a dark hole in b) for showing blurring development with TE increasing. The insert plot shows that the edge width at half maximum increases with TE increasing due to blurring.

