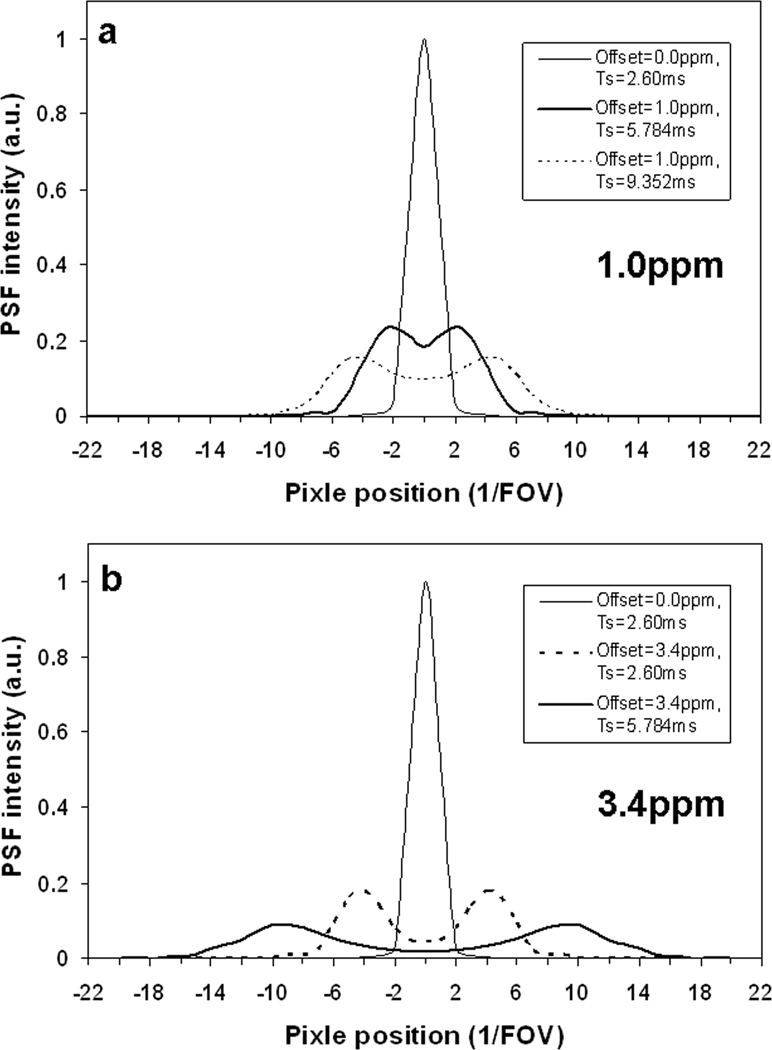
Fig. 4.

Center-pass profiles of the point spread functions in Fig. 3: a) 1.0ppm and b) 3.4ppm. Double-peak lines in a)-b) were from the ring-shape distributions in Fig. 3, while single-peak lines were from the disk-shape distribution at zero-offset frequency. Note that the intensity at the center of the double peaks in a)-b) decreases with offset frequency or readout time.
