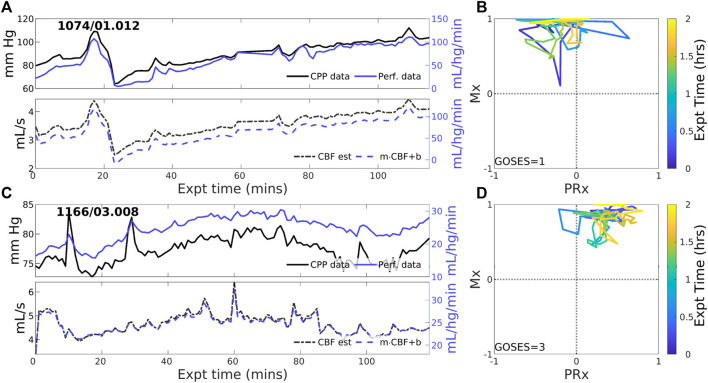
FIGURE 2.
Two example experiments with positive PFR. (upper panels of (A,C)) Experiments in this set show consistent, positive coordination between CPP (black) and perfusion (blue) observational data. (lower panels) Model estimated CBF (black, dashed) follows changes in CPP; posterior correction (blue, dashed) preserves the original orientation of the estimate without a change in sign. (panels (B,D)) The associated trajectories in correlation indices show strongly positive Mx values, while PRx may be variable including sign changes.

