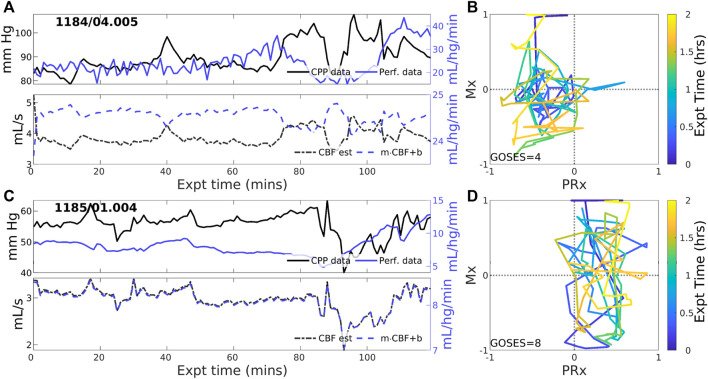
FIGURE 3.
Two example experiments with zero PFR. The layout is the same as in Figure 2. Pressure (solid black) and perfusion (solid blue) data do not consistently coordinate over the 2-h experiment (upper panels of (A,C)). As a result, no suitable choice of Control parameters, corresponding to CA mechanisms, must alternate between positive and negative values to simulate these data for which no single PFR hypothesis suffices.

