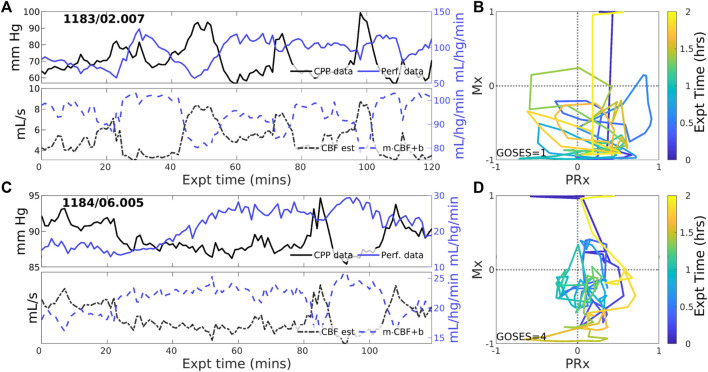
FIGURE 4.
Example experiments with negatively-signed PFR. The layout is the same as the previous figure. Negative coordination between CPP (blue) and perfusion (magenta) observational data persists throughout many 2-h experiments. Model estimated CBF (blue, dashed) follows changes in CPP and requires a sign change in the posterior correction (dashed blue) match observed perfusion. Both Mx and PRx can be highly variable in these cases whose underlying causes are not known.

