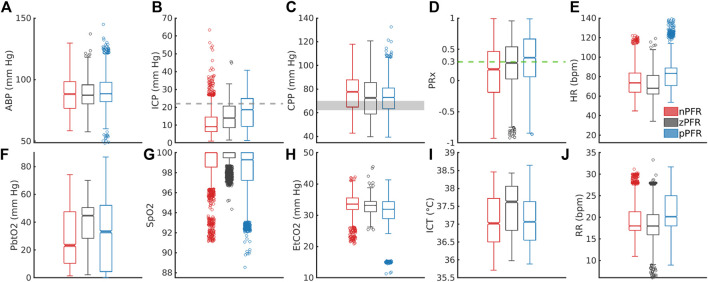
FIGURE 6.
Distribution of 1-min averaged data in PFR-identified experiments. In the top row, panels (A–E) show ABP, ICP, CPP, PRx, and heart rate (HR), respectively. In the bottom row, panels (F–J) show PbtO2, SpO2, EtCO2, ICT, and respiratory rate (RR), respectively. (C) CPP medians exceed the protocol target range of 60–70 mm Hg (grey). Both brain tissue oxygenation (F) and ICT (I) are elevated in zPFR relative to other data, although this may also reflect differences in patient care during intervals selected for experiment. Fully characterizing nPFR likely requires finer temporal and patient-specific analysis to identify the respective influences of high and low ICP, EtCO2, both systemic and brain-tissue metabolic factors.

