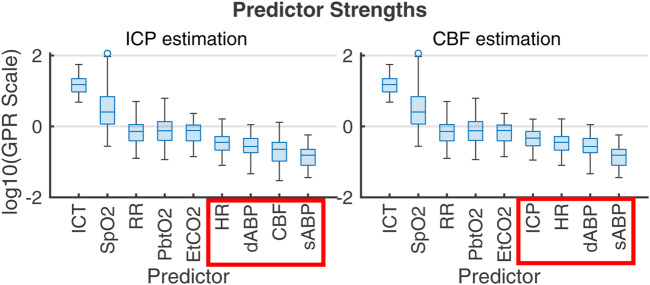
FIGURE 7.
Gaussian process regression fitting of ICP (left) and CBF (right) from 1-s averaged data across the 83 2-h experiment intervals. Box plots give the distribution of scales of predictor influence on a logarithmic scale ordered decreasingly by median. ICHD model variables, indicated in red boxes, have low empirical predictive rank over the 2-h timescale. Importance rank is found by automatic relevance determination (ARD) (MacKay and Neal, 1994; Radford, 2012) using kernel function parameters associated with each predictor’s scale factor. The ranking is robust under alternate regression strategies (e.g., Lasso and Ridge Regression).

