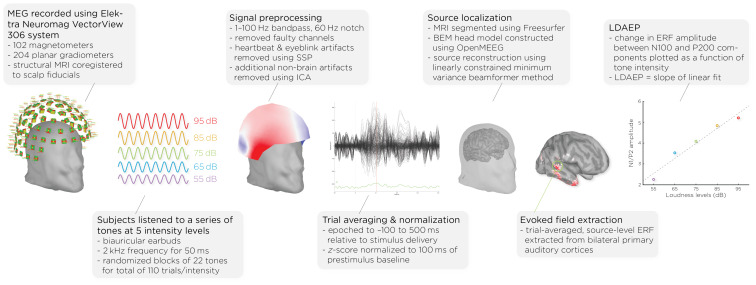
Figure 1.
Workflow of MEG acquisition and data processing, detailing the steps from signal acquisition to data analysis. It shows the MEG setup, signal preprocessing, auditory stimulus presentation, data normalization, brain activity source localization, and the quantification of auditory evoked fields (AEFs) across different sound intensity levels.

