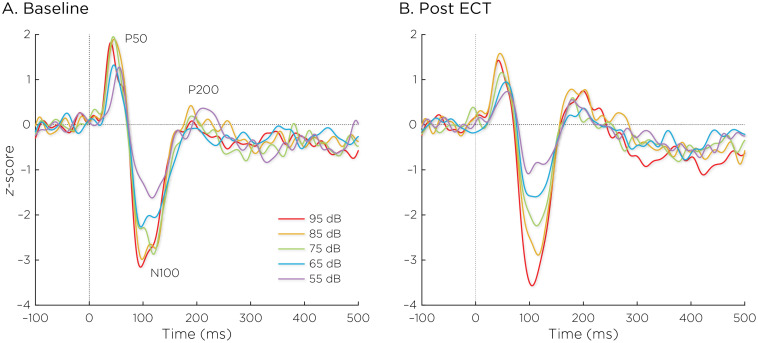
Figure 2.
Auditory evoked fields (A) before and (B) after ECT treatment, with responses at sound pressure levels of 55–95dB. The change in normalized evoked field amplitude between the N100 and P200 (N1/P2) components of the trial-averaged epochs was calculated. The LDAEP is calculated as the slope of linear regression line that best fits the N1/P2 amplitudes at each sound pressure level.

