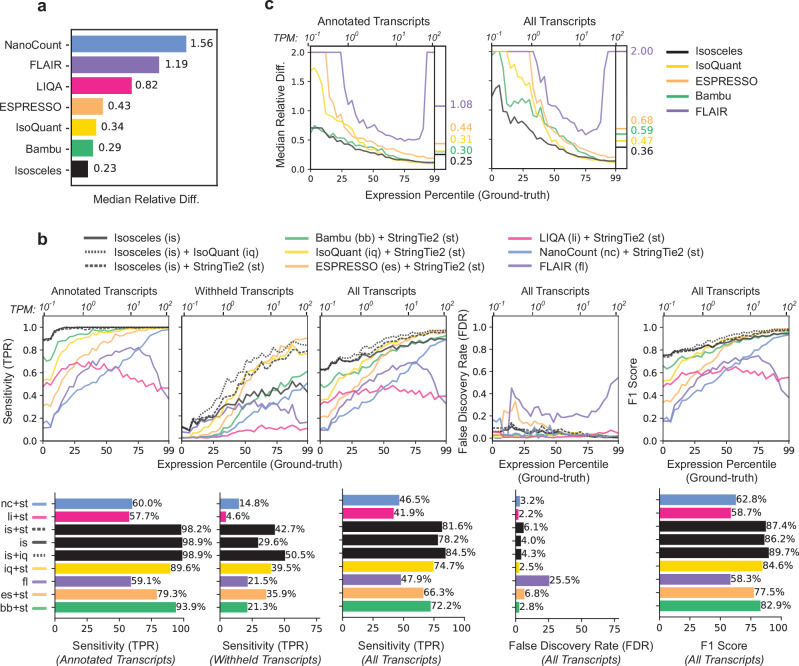
Fig. 2. Quantification and transcript detection benchmarks against ground-truth using simulated long-read data.
a Median relative difference of transcripts per million [TPM] values as defined by abs(ground_truth - predicted) / ((ground_truth + predicted)/2) for each method on reference transcripts. b Downsampling benchmarks for 30% transcripts withheld. Transcript detection defined as TPM > 0, the TPR, FDR and F1 score metrics as a function of the expression percentile (primary x-axis) and TPM values (secondary x-axis) of the simulated transcripts. For each program, the better of either single-program or pre-detection combination is plotted (see Supplementary Fig. 2 for all combinations), with TPR stratified by annotated, withheld and all transcripts alongside FDR and F1 score, with overall values plotted as bars below the graphs. c Median relative difference of annotated and withheld transcripts (30% downsampling) as a function of the simulated expression level, as defined for panel b. Source data are provided as Source Data files.

