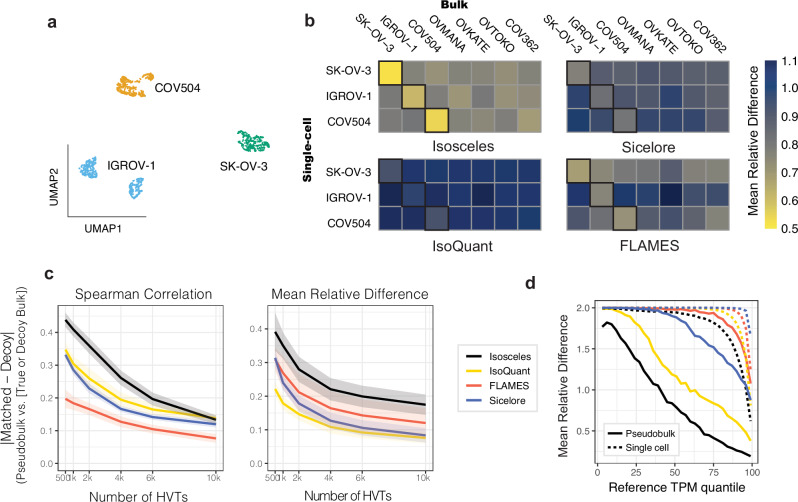
Fig. 3. Quantification fidelity and cell type benchmark using single-cell nanopore data.
a 2D UMAP embedding of transcript-expression level quantifications from nanopore data of pooled IGROV-1, SK-OV-3, and COV504 ovarian cell lines, subsequently colored by genetic identity (according to Souporcell). b Mean relative difference (color scale) of each program’s quantifications across resolutions (pseudo-bulk vs. bulk data) for the top 4,000 highly variable transcripts. c Absolute difference between matched and decoy cell lines across a range of 500-10,000 highly variable transcripts (HVT) comparing mean relative difference and Spearman correlation metrics (shaded ribbons provide the upper and lower bounds of std. error). d Mean relative difference (as defined for Fig. 2a) between ground-truth and estimated TPM values from simulated reads at pseudo-bulk (solid lines) and single-cell level (dashed lines). Source data are provided as Source Data files.

