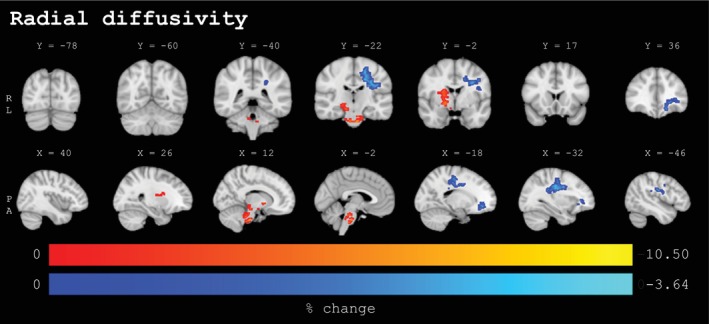
FIGURE 3.

Percentage change values for clusters (≥50 voxels) with statistically significant baseline to post‐season changes from voxel‐wise analyses for radial diffusivity (n = 131, p < .025, FWE‐corrected, covariates: sex, site) in coronal (upper panel) and sagittal (lower panel) view. The lower panel extends from the left to the right hemisphere. Significant voxels underwent linear interpolation for enhanced visualization. Sport‐season‐related increases are depicted in red‐yellow, decreases are depicted in blue‐lightblue. Results are overlaid on the MNI152‐T1‐1mm standard image in radiological convention (right = subject's left). Details on individual clusters are given in Table 3. X/Y = standard space coordinate of slice (x/y‐direction), R = right, L = left, P = posterior, A = anterior.
