
FIGURE 3.
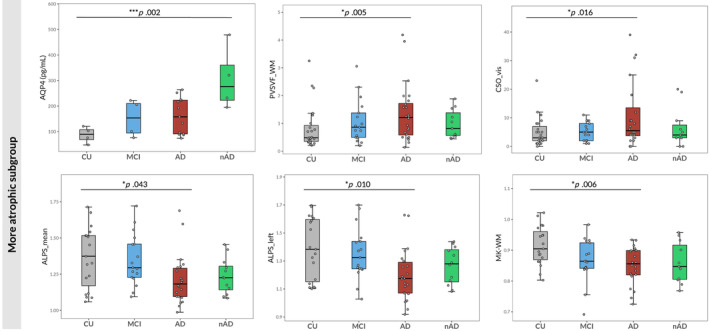
Group comparisons including only more atrophic degenerative patients. Boxplots of the differences in AQP4 levels, PVSVF_WM, visual scores of PVS in the CSO, ALPS_mean, ALPS_left and MK‐WM among cognitively unimpaired (CU) individuals, patients with MCI, patients with AD with higher GM atrophy and patients with degenerative diseases different from AD with higher GM atrophy (nAD). The p values correspond to the generalized linear model analysis (Model 1). Statistical significance was set at p < .05.