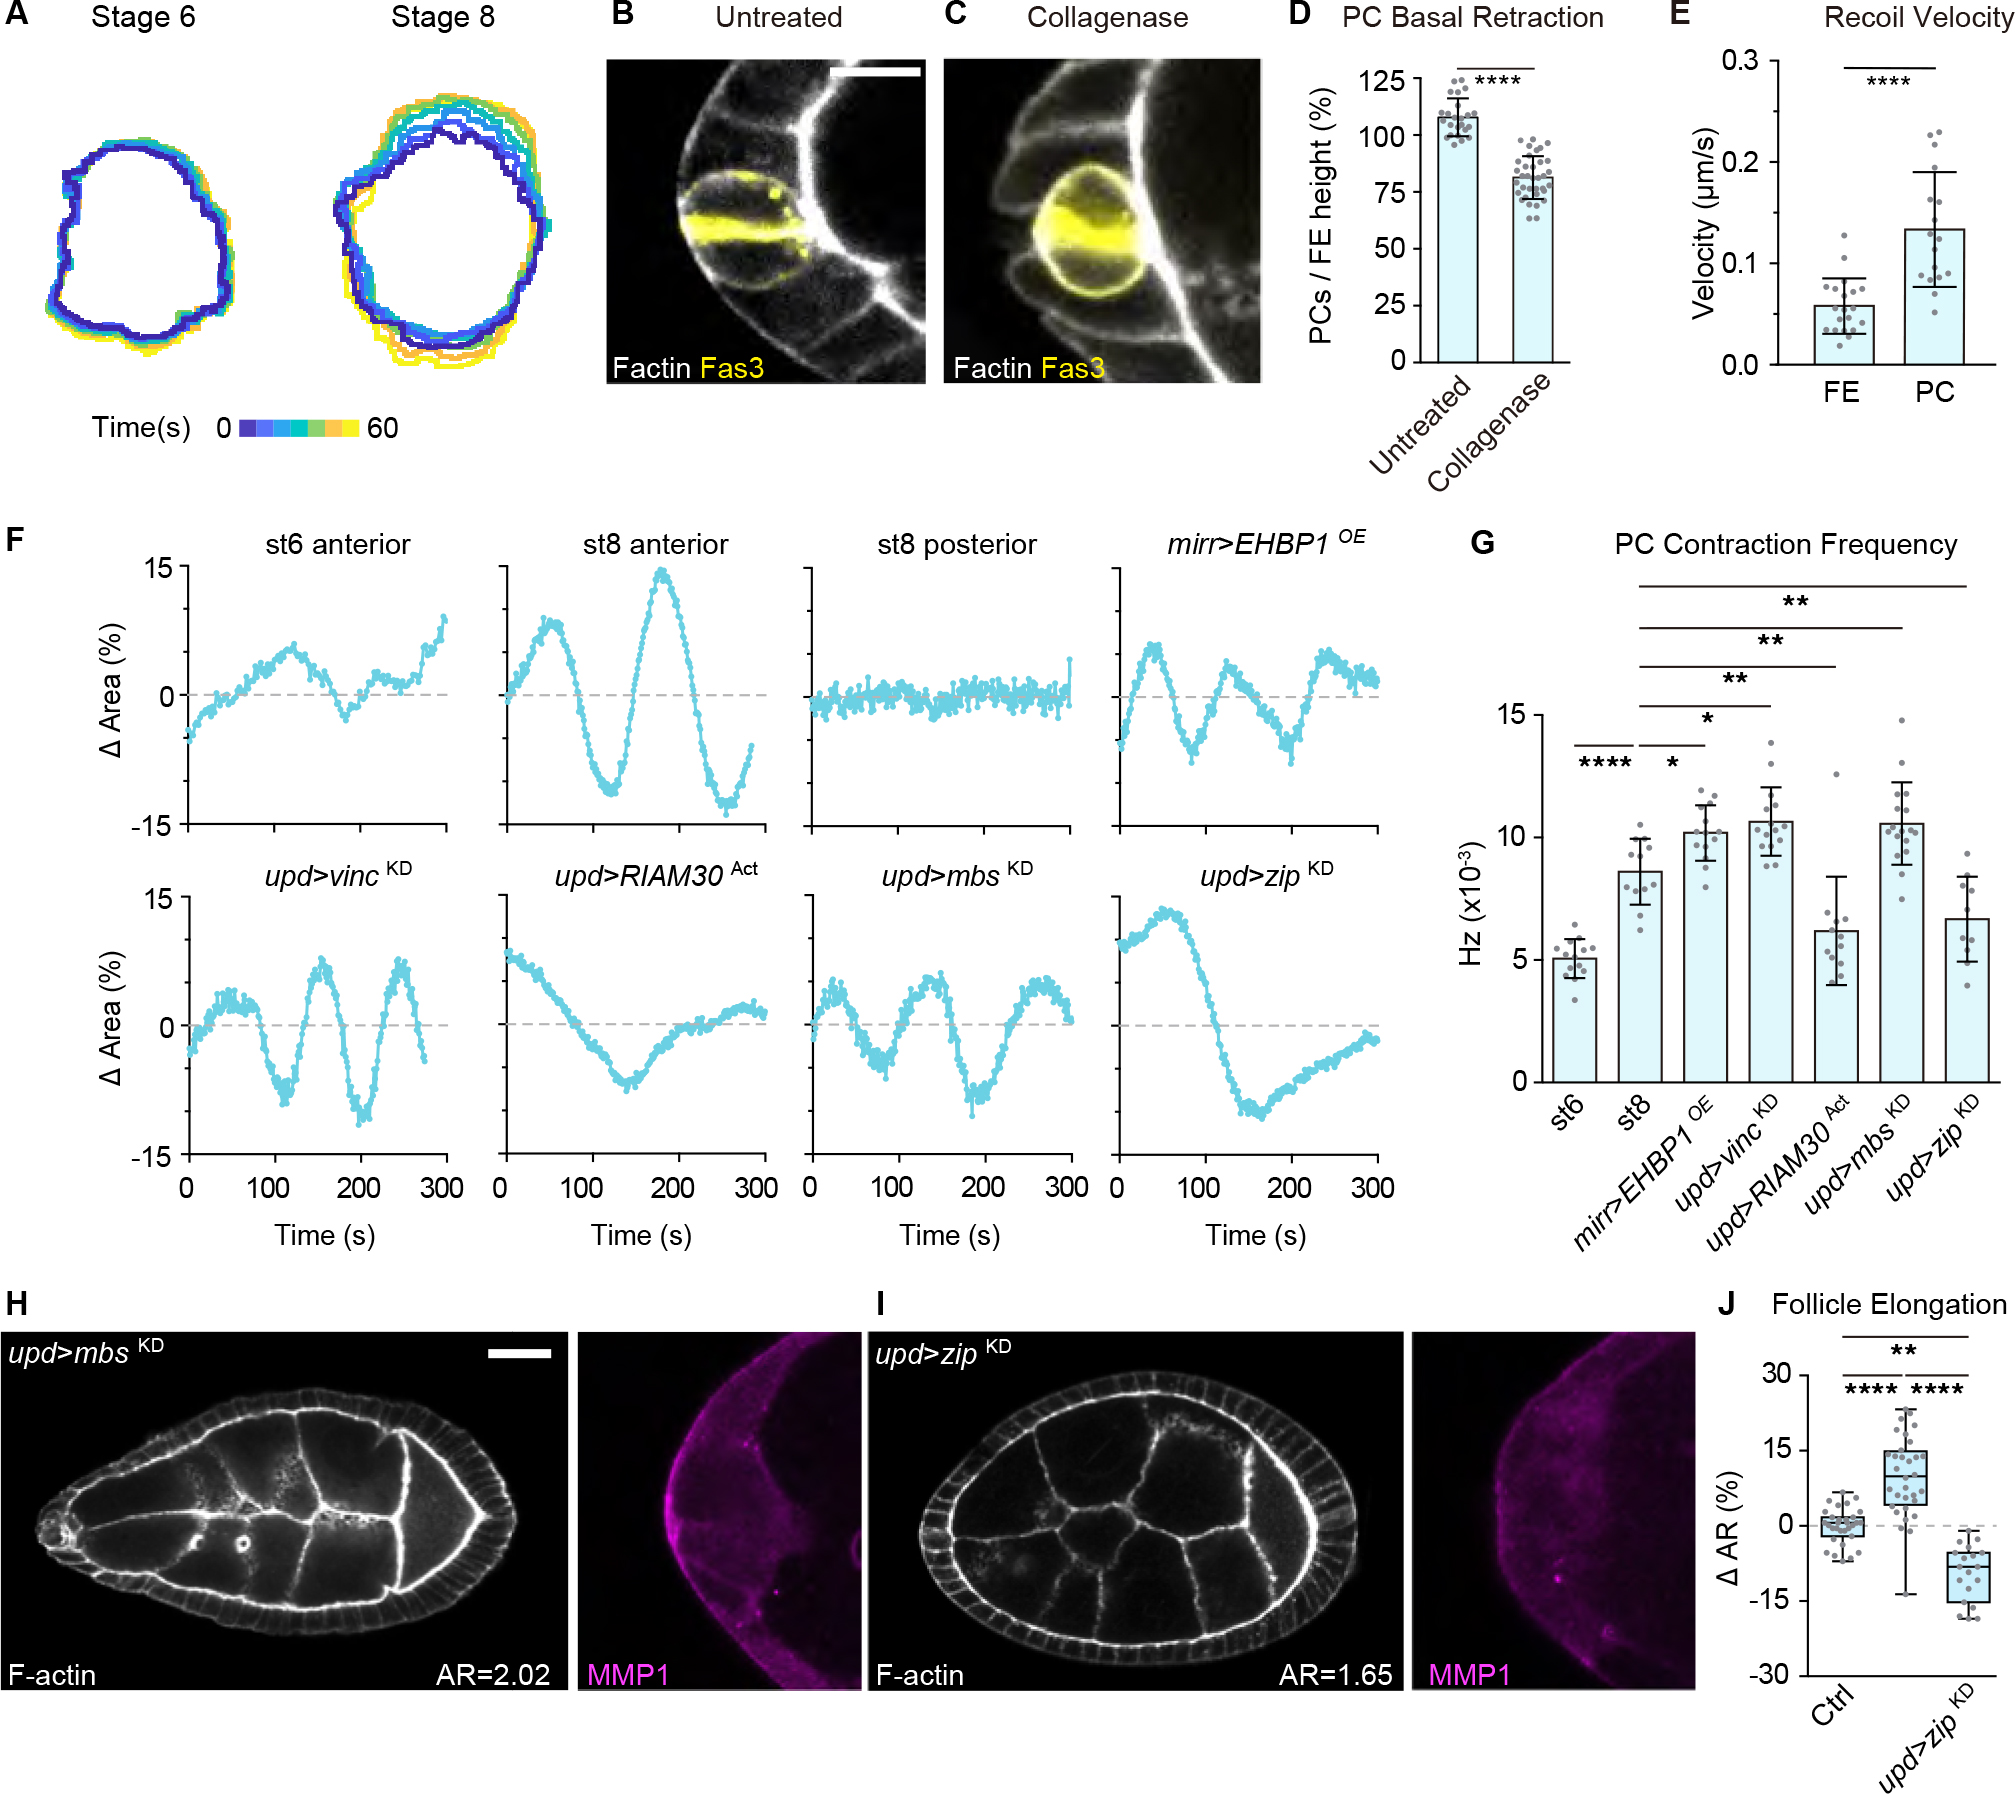
Figure 7. PCs tug on the BM for mechanical sensing.

(A) Dynamic contractility of anterior PCs in live follicles. Outlines of Fas3-GFP signals are overlayed and color-coded according to time (stage 6, n=14; stage 8, n=12, Video S4).
(B-C) PCs (labeled by Fas3 staining, yellow) in untreated (B, n=24) or collagenase-treated (C, n=35) follicles. Scale bars: 10 μm.
(D) Quantitation of PC basal retraction, normalized to the immediate neighboring follicle epithelium. Statistics used unpaired Mann-Whitney test.
(E) Recoil velocity of lateral plasma membranes following cortical severing with a 2-photon laser. Recoil is higher in PCs (n=17) then follicle epithelial cells (n=20). Statistics used unpaired Mann-Whitney test.
(F) Single PC contractility dynamics over time. PCs in control (anterior: stage 6, n=14; stage 8 n=12; posterior: stage 8 n=12) and manipulated (central stiffening: mirr>EHBP1OE, n=14; PC mutants: upd>vincKD, n=15; upd>RIAM30Act, n=12; upd>mbsKD, n=17; upd>zipKD, n=10, see Video S5) stage 8 follicles.
(G) Quantitation of PC contraction frequency in control and manipulated follicles. Statistics used KS (Kolmogorov-Smirnov) test.
(H-I) Increasing PC contractility (H, upd>mbsKD, n=31) leads to follicle hyperelongation and MMP1 upregulation, while decreasing PC contractilty (I, upd>zipKD, n=23) has the opposite effect.
(J) Quantitation of aspect ratios in H, I. Statistics used ANOVA with Dunnett’s multiple comparisons.
