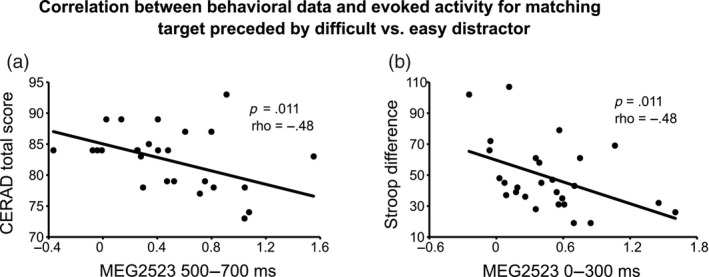
FIGURE 4.

Scatterplots demonstrating the statistically significant correlations between neural activity measures and behavioral measures. Significant correlations were detected exclusively for evoked activity reflecting ease of retrieval, specifically for the difference in strength for the target‐evoked response after a difficult versus an easy distractor. For each scatterplot, we report the significant p‐value and Spearman's rho. (a) Scatterplot between neural measures (x‐axis; in ft/cm) and CERAD scores (y‐axis). (b) Scatterplot between neural measures (x‐axis; in ft/cm) and the Stroop difference (y‐axis; in s). MEG, magnetoencephalography.
