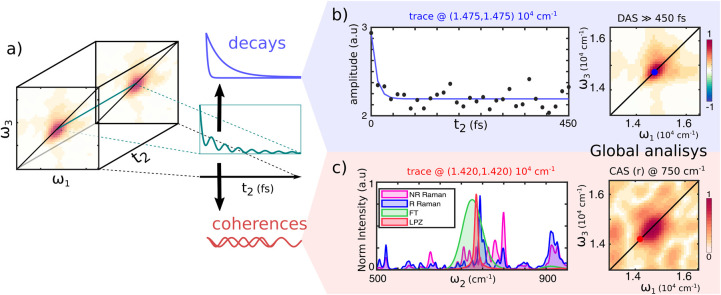
Figure 3.
(a) Schematic illustration of 2DES data. The nonlinear signal along t2 is a sum of different decaying or oscillating contributions. (b) Signal decay trace along t2 extracted at the peak’s maximum, ω1 = ω3 = 14,750 cm–1 (scatter), and its global fit (blue line). After the initial ultrafast decay, the signal evolution is flat. The lack of signal evolution is confirmed at every coordinate by the 2D-DAS from the global fitting with a characteristic time much longer than the experimental range. (c) An analysis of the residuals of the global fitting shows the presence of structured oscillations in the signal. The FFT (green) and linear predictor Z-transforms27 (LPZ, red) applied to the residuals of the global fitting highlight the presence of an oscillation at 750 cm–1. The same frequency component appears in the resonant (blue) Raman spectrum, whereas it is less evident in the nonresonant (pink) one (633 and 514 nm laser excitation, respectively) of chlorophyll a in ethanol, suggesting that this component comes from vibrational coherences of the molecule. The 750 cm–1 component is also retrieved from the global fitting with oscillating functions, returning a 2D-CAS map (right) with an intensity distribution like the one in the 2D-DAS.

