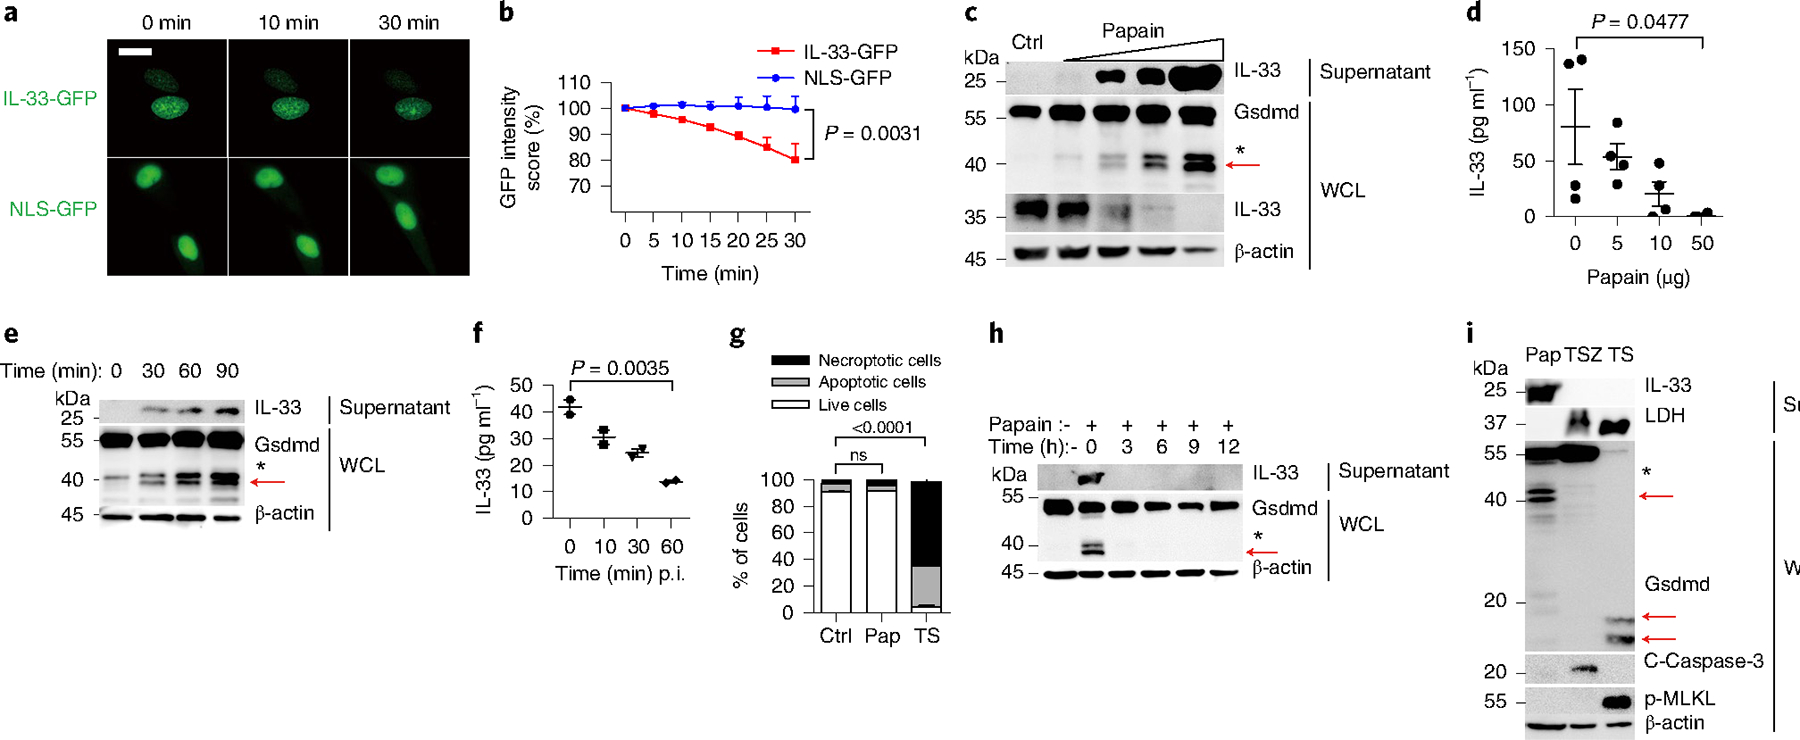
Fig. 1 |. Allergen stimulates IL-33 secretion and Gsdmd fragmentation.

a, Live-cell imaging of IL-33-GFP and NLS-GFP in A549 cells exposed to 5 μg of papain for the indicated time. Scale bars, 15 μm. b, GFP intensity statistics (ImageJ) of IL-33-GFP expression and NLS-GFP expression as in a. c, Immunoblot analysis of IL-33 and Gsdmd in MLE-12 cells after papain (1 μg, 5 μg, 10 μg and 50 μg) exposure for 30 min. Ctrl, no stimulation. d, ELISA analysis of IL-33 in WCL of MLE-12 cells stimulated with papain for 30 min. e, Immunoblot analysis of IL-33 and Gsdmd in MLE-12 cells after 5 μg well−1 papain exposure for the indicated time. f, ELISA analysis of IL-33 in WCL from MLE-12 cells with 5 μg well−1 papain exposure for the indicated time. Representative of four independent experiments. p.i., post infection. g, Flow cytometry analysis of MLE-12 cell survival with indicated stimulations. Ctrl, no stimulation; Pap, exposure to 10 μg of papain for 30 min; TS, TNF-α+SM-164 stimulation for 12 h; ns, not significant. Live cell, PI−annexinV−; apoptotic cell, PI−annexinV+; necroptotic cell, PI+annexinV+. h, Immunoblot analysis of MLE-12 cells stimulated with papain (5 μg) for 30 min followed by removal of papain for the indicated time. i, Immunoblot analysis of MLE-12 cells stimulated with papain (Pap, 100 μg well−1) for 30 min, TSZ (TNF-α+SM-164+Z-VAD-FMK) for 12 h and TS (TNF-α+SM-164) for 12 h. Red arrows indicate the functional p40 NT-Gsdmd. Nonspecific fragments marked with an asterisk were not discussed in our work. Error bar, mean ± s.e.m. b, n = 2, using a two-tailed, unpaired Student’s t-test; d, n = 4, f, n = 2, g, n = 3, with Dunnett’s multiple comparisons test. All data are representative of at least three independent experiments.
