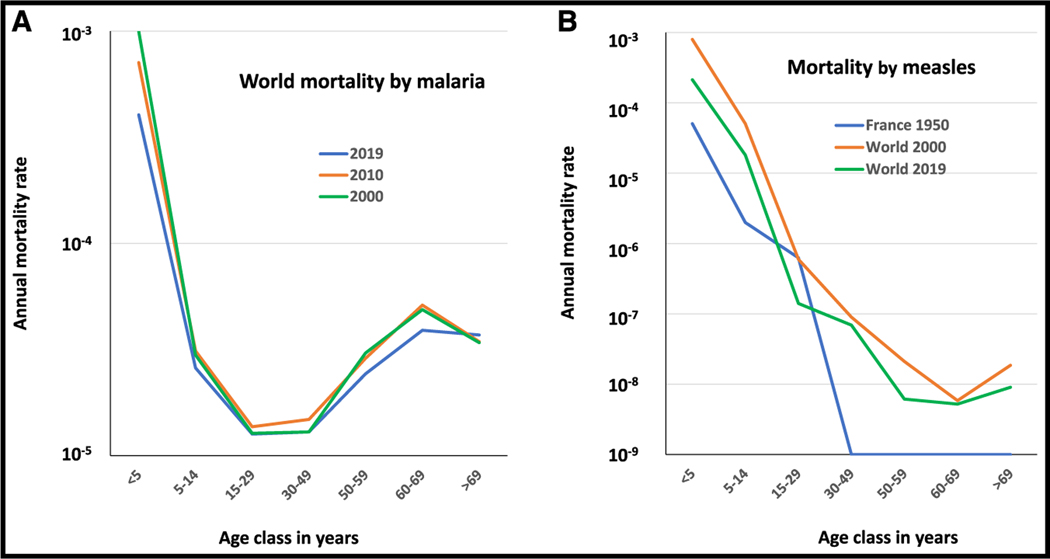
Figure 2. Annual mortality rates (log scale) as a function of age for two infectious diseases with L-shaped curves.
(A) Worldwide mortality rates for malaria reported in 2000 (green), 2010 (orange), and 2019 (blue) by the WHO.
(B) Mortality rates for measles reported by the WHO in France in 1950 before vaccination (blue) and worldwide in 2000 (orange) and 2019 (green). Raw data for Figure 2 are in supplemental Table 2 (data availability).

