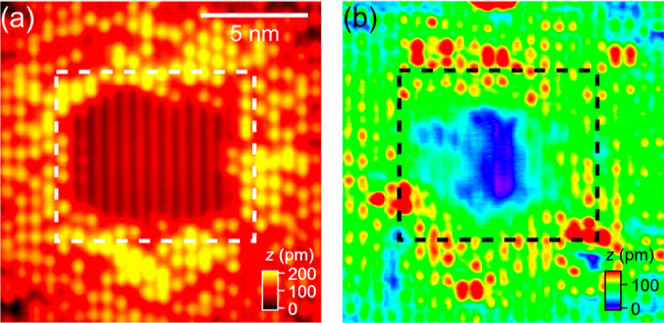
Figure 2.

(a) ES- and (b) FS- images of h-TiO2 recorded after sequential removal of the capping Hs of all OHbs in the central part of the scanned region using +3.5 V, 1 ms tip pulses. The images were recorded at 7 K. Image size: (15 nm)2. Scan parameters (V, I): (a) +2 V, 10 pA; (b) −2 V, 1 pA.
