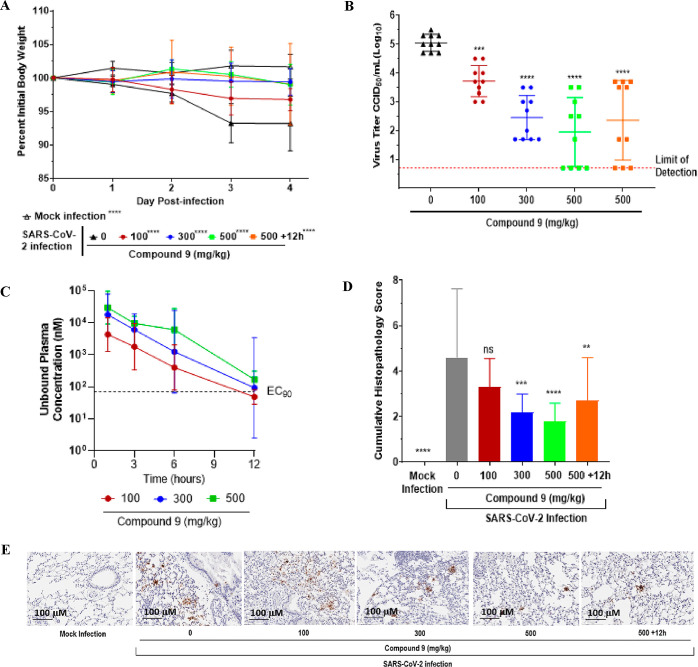
Figure 6.
Five mice per group were challenged intranasally with 1 × 105.0 50% CCID50 of SARS-CoV-2 MA10. Animals were orally administered 0, 100, 300 or 500 mg/kg BID of 9 throughout the duration of the study starting at 4 h post infection (hpi) or 500 mg/kg BID 9 starting at 12 hpi. Animals were euthanized at 4 days post infection (dpi) and lungs collected for virus titers. Data (for A–D) were compiled from two independent studies (n = 10 BALB/c mice). (A) Weight loss during infection. Mice were weighed daily. (B) Lung viral titer at 4 dpi. Lung titers are plotted as mean log10 CCID50/ml ± SEM. Dotted line represents the limit of detection for the CCID50 assay. (C) Twelve-hour compound 9 exposure levels of 100, 300 and 500 mg/kg doses in uninfected, orally treated mice. EC90 represented as determined in the day 3 dNHBE primary cell assay (D) Histopathology scores on a scale of 0 to 5, where 0 is a normal healthy lung and 5 is severe coalescing areas of necrosis and confluent areas of inflammation. (E) SARS-CoV-2 nucleocapsid protein immunohistochemistry. Shown are digital light microscopic scans of mouse lung tissue sections of mock-infected, 0, 100, 300, 500 and +12 h 500 mg/kg doses of 9-treated mice stained with SARS-CoV-2 nucleocapsid antibody. Data are scans from one study. Scale bars, 100 μm. Magnification is 20×.

