
Fig. 2 |. MLL family HMTs have divergent activities on Borealin.
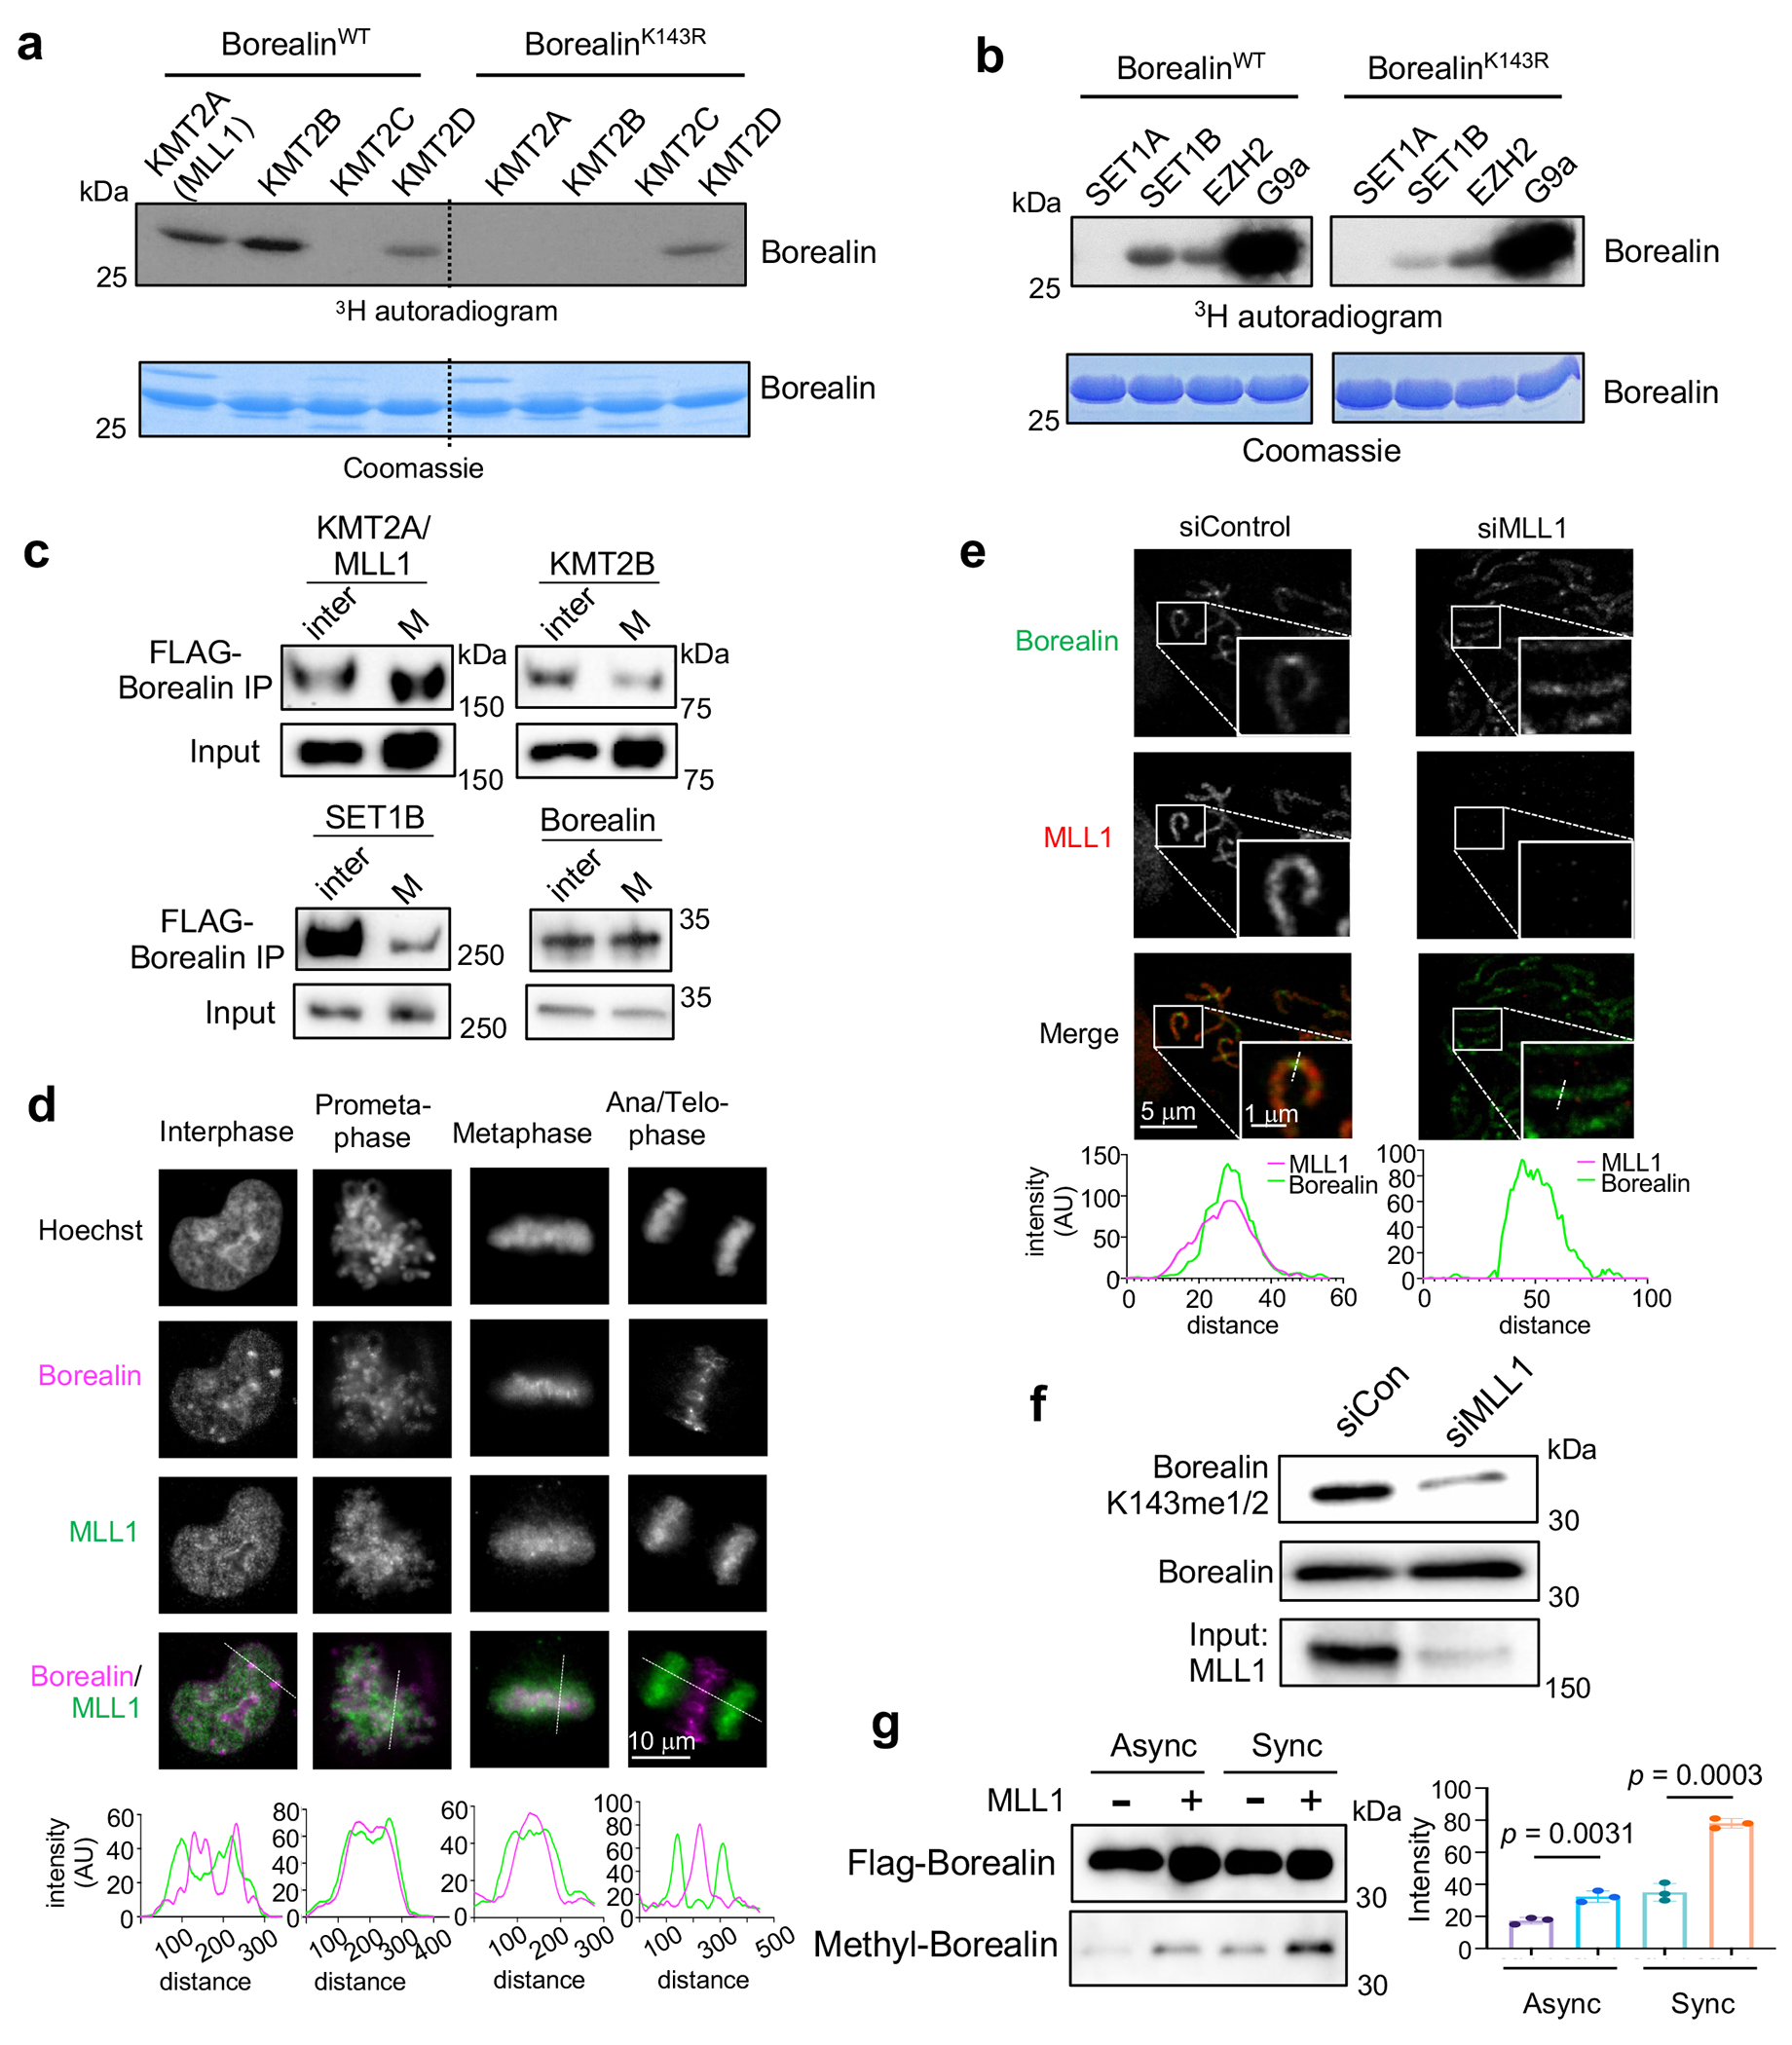
(a) and (b) In vitro methylation assay using indicated KMT enzymes on top. Either WT or K143R mutant Borealin were used as the substrate. Coomassie stain of Borealin proteins was shown in lower panels. This experiment is independently repeated three times with similar results.
(c) Immunoblots for FLAG-Borealin immunoprecipitated from asynchronized or mitotically synchronized HeLa cells. Antibodies were indicated on top. Inter, interphase, M, mitosis. Representative results from two independent experiments were presented.
(d) Immunofluorescence for Borealin and MLL1 in HeLa cells at interphase or different mitotic stages as indicated on top. DNA was stained by Hoechst. The one-dimension (1D) line graphs of MLL1 (green) and Borealin (magenta) signals were shown at bottom. The viewpoint was indicated by dash line. Scale bar, 10 μm. This experiment is independently repeated three times with similar results.
(e) Immunofluorescence for Borealin and MLL1 on mitotic chromosomes of synchronized HeLa cells treated with control or MLL1 siRNA. The 1D line graphs of MLL1 (magenta) and Borealin (green) signals were shown on right. The viewpoint was indicated by dash line in the inset. Scale bar, 5 μm (whole images) and 1 μm (insets). This experiment is independently repeated two times with similar results.
(f) Immunoblot for antibodies indicated on left for mitotically synchronized HeLa cells treated with control or MLL1 siRNA. This experiment is independently repeated two times with similar results.
(g) Immunoblot for Borealin or methylated Borealin in asynchronized or mitotically synchronized 293T cells with or without transient overexpression of MLL1 as indicated on top. Quantification of methyl-Borealin after normalization against input was shown on the right. Data are presented as mean values +/− SEM. The p-value for n = 3 independent experiments was calculated using two-tailed unpaired Student’s t-test.