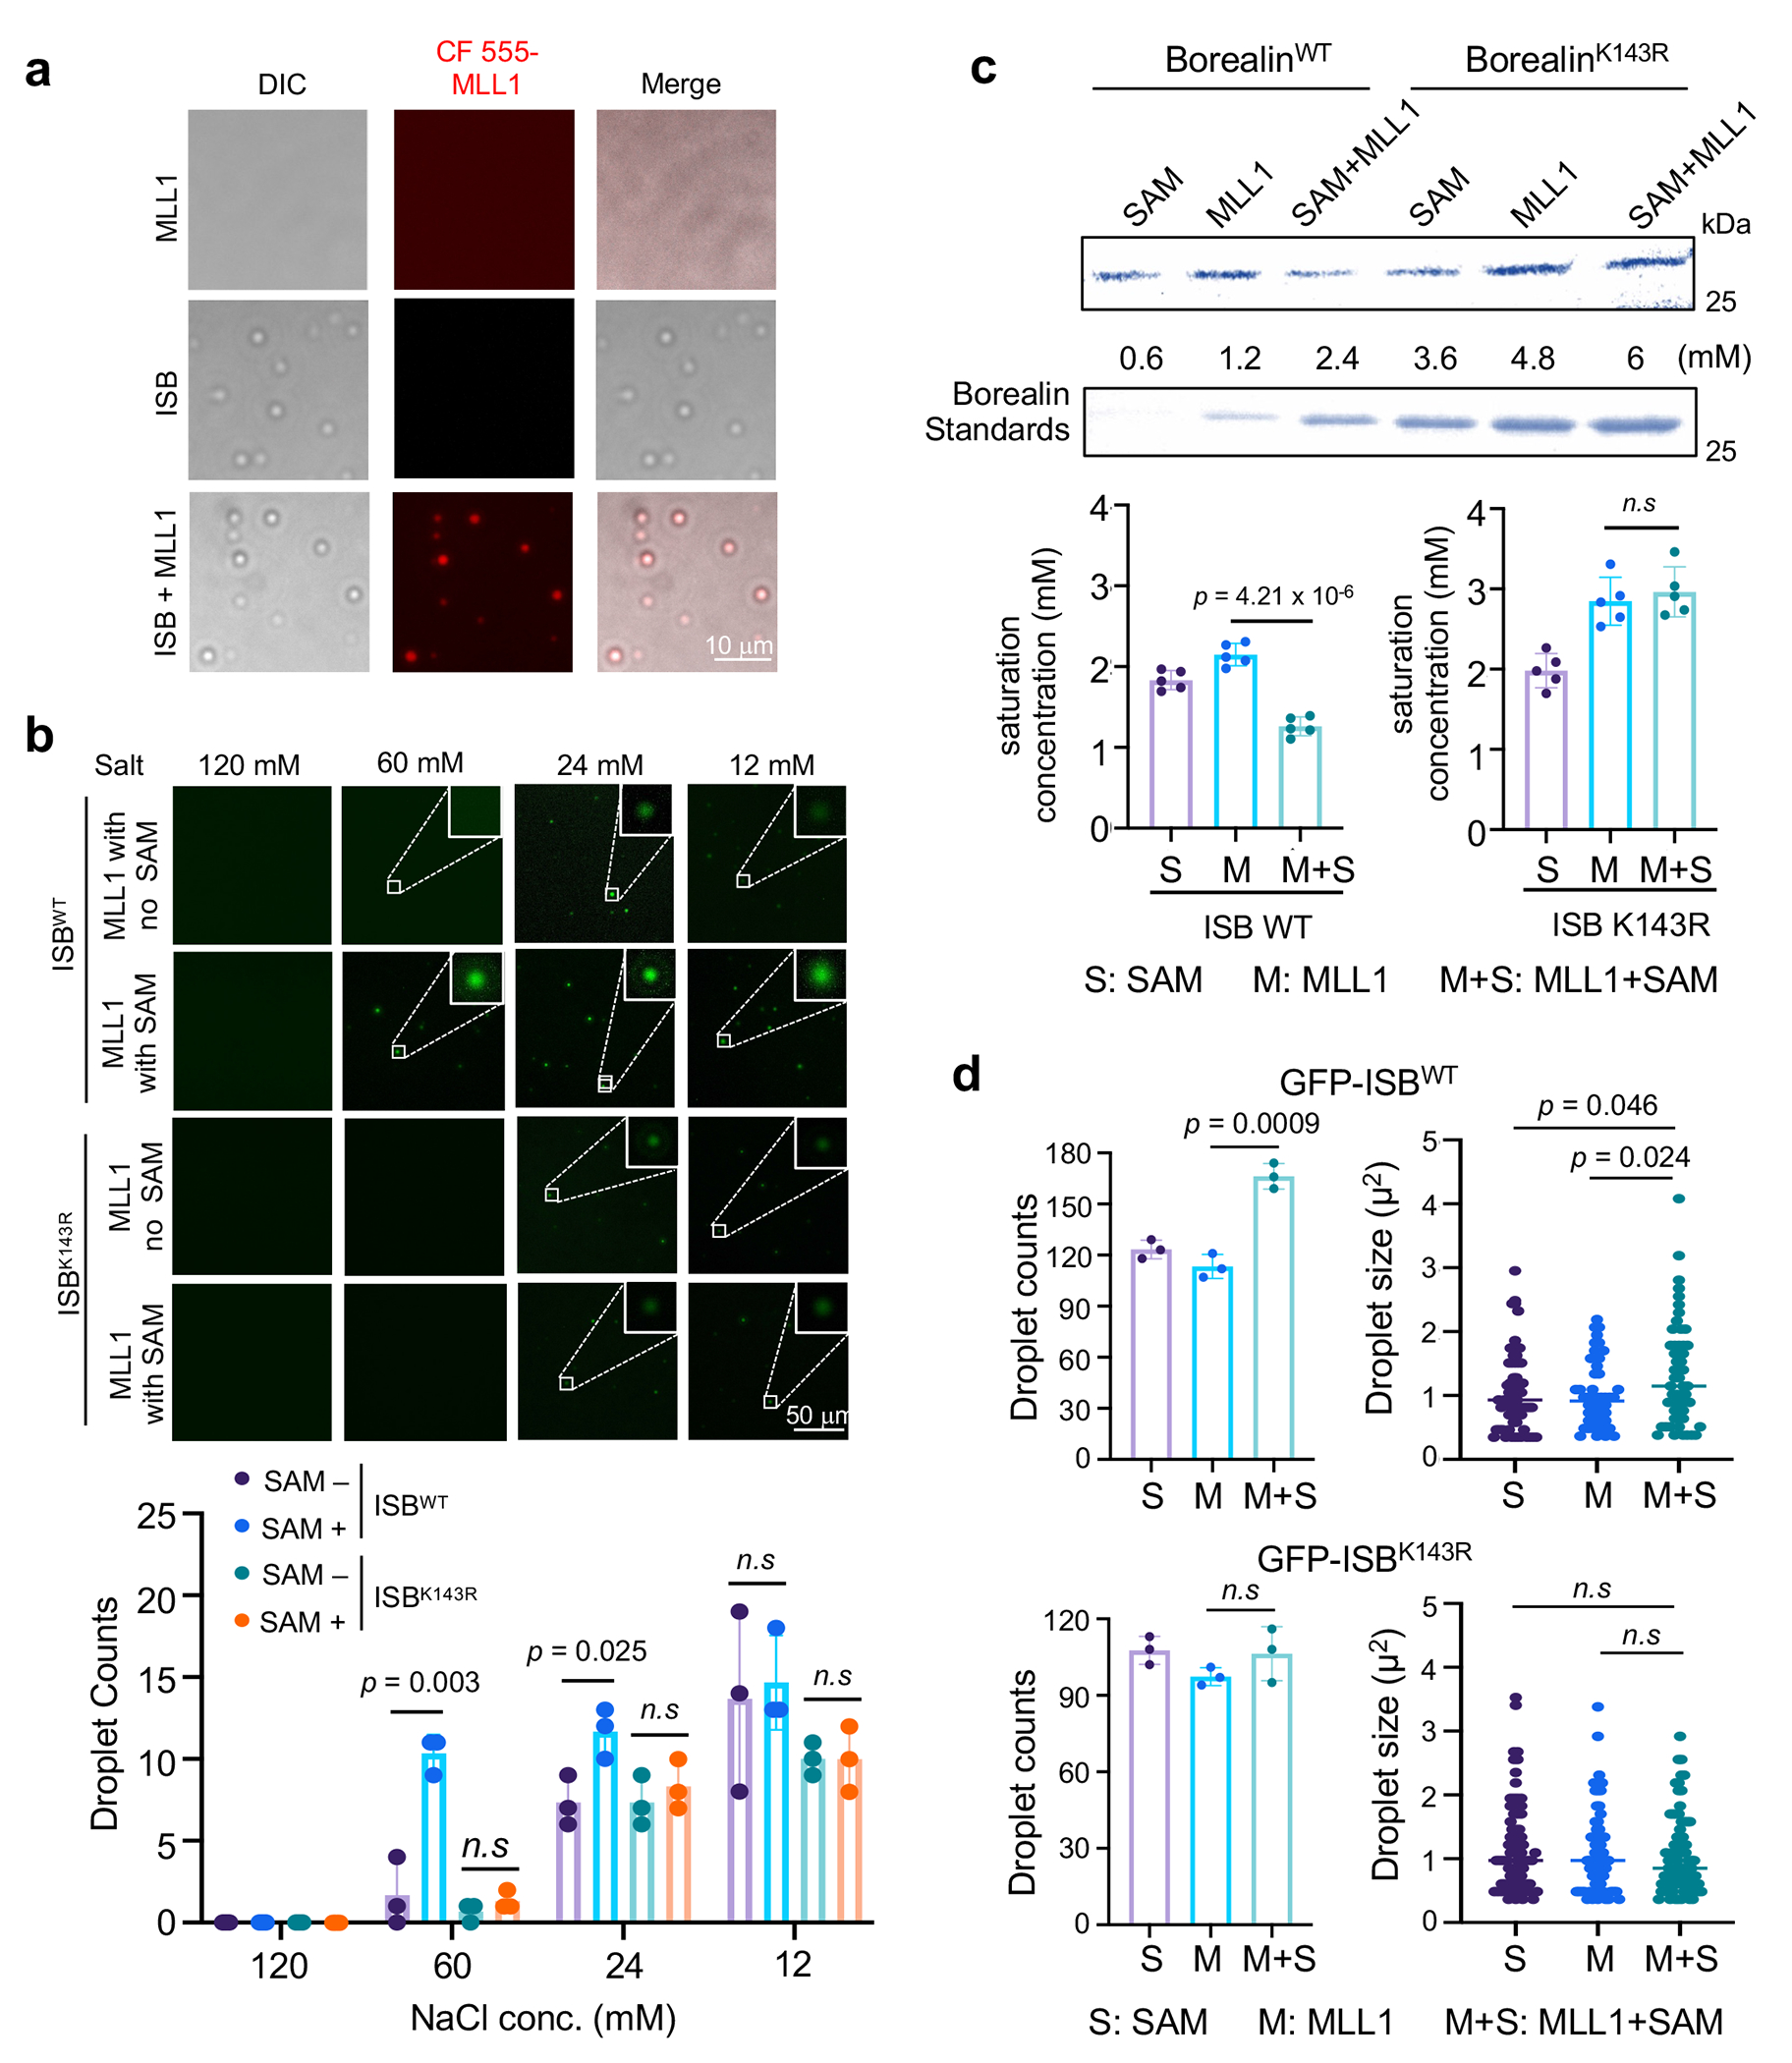
Fig. 3 |. Borealin K143 methylation by MLL1 regulates CPC phase separation in vitro.

(a) Representative micrographs from three independent experiments showing enrichment of the CF-555 labeled MLL1 core complex (CF555-MLL1) in the ISB coacervates. MLL1 (0.5 μM), ISB (10 μM), or both were incubated in the partitioning buffer containing 50 mM Tris-HCl pH7.5, 150 mM NaCl, 1 mM DTT and 5% PGE-3350. Scale bar, 10 μm. This experiment is independently repeated three times with similar results.
(b) Immunofluorescence for droplet formation of the GFP-ISBWT or GFP-ISBK143R complex under indicated salt concentrations. Scale bar, 50 μm. Quantification of GFP-ISB droplets is shown on bottom. Average results from three independent experiments were presented with +/− SEM. The p-values were calculated using two-tailed unpaired Student’s t-test. n.s, p > 0.05.
(c) Coomassie stain of Borealin protein of ISB complex in the soluble phase after sedimentation of ISB droplets. A gradient of Borealin in high salt buffer is shown as a reference of protein concentration. About 6 μM ISB complex was incubated with SAM alone (S), MLL1 core complex alone (M) or both (M+S) in the HMT buffer for overnight to allow Borealin methylation. Phase separation of ISB was induced by lowering salt concentration and the liquid droplets were separated from the soluble fraction by sedimentation. The saturation concentration of ISB was quantified for ISBWT or ISBK143R on bottom. Data are presented as mean values +/− SEM. The p-value for n = 5 independent experiments was calculated using two-tailed unpaired Student’s t-test. n.s, p > 0.05.
(d) Quantification of GFP-ISBWT or GFP-ISBK143R droplet size after HMT assay and induction of phase separation as described in (c). Average values of droplet count from n = 3 independent expeiments with +/− SEM were shown on the left. Droplet size was measured for at least 96 droplets per condition and shown on the right. The p-value was calculated using two-tailed unpaired Student’s t-test. n.s, p > 0.05. The lines represent mean value.
