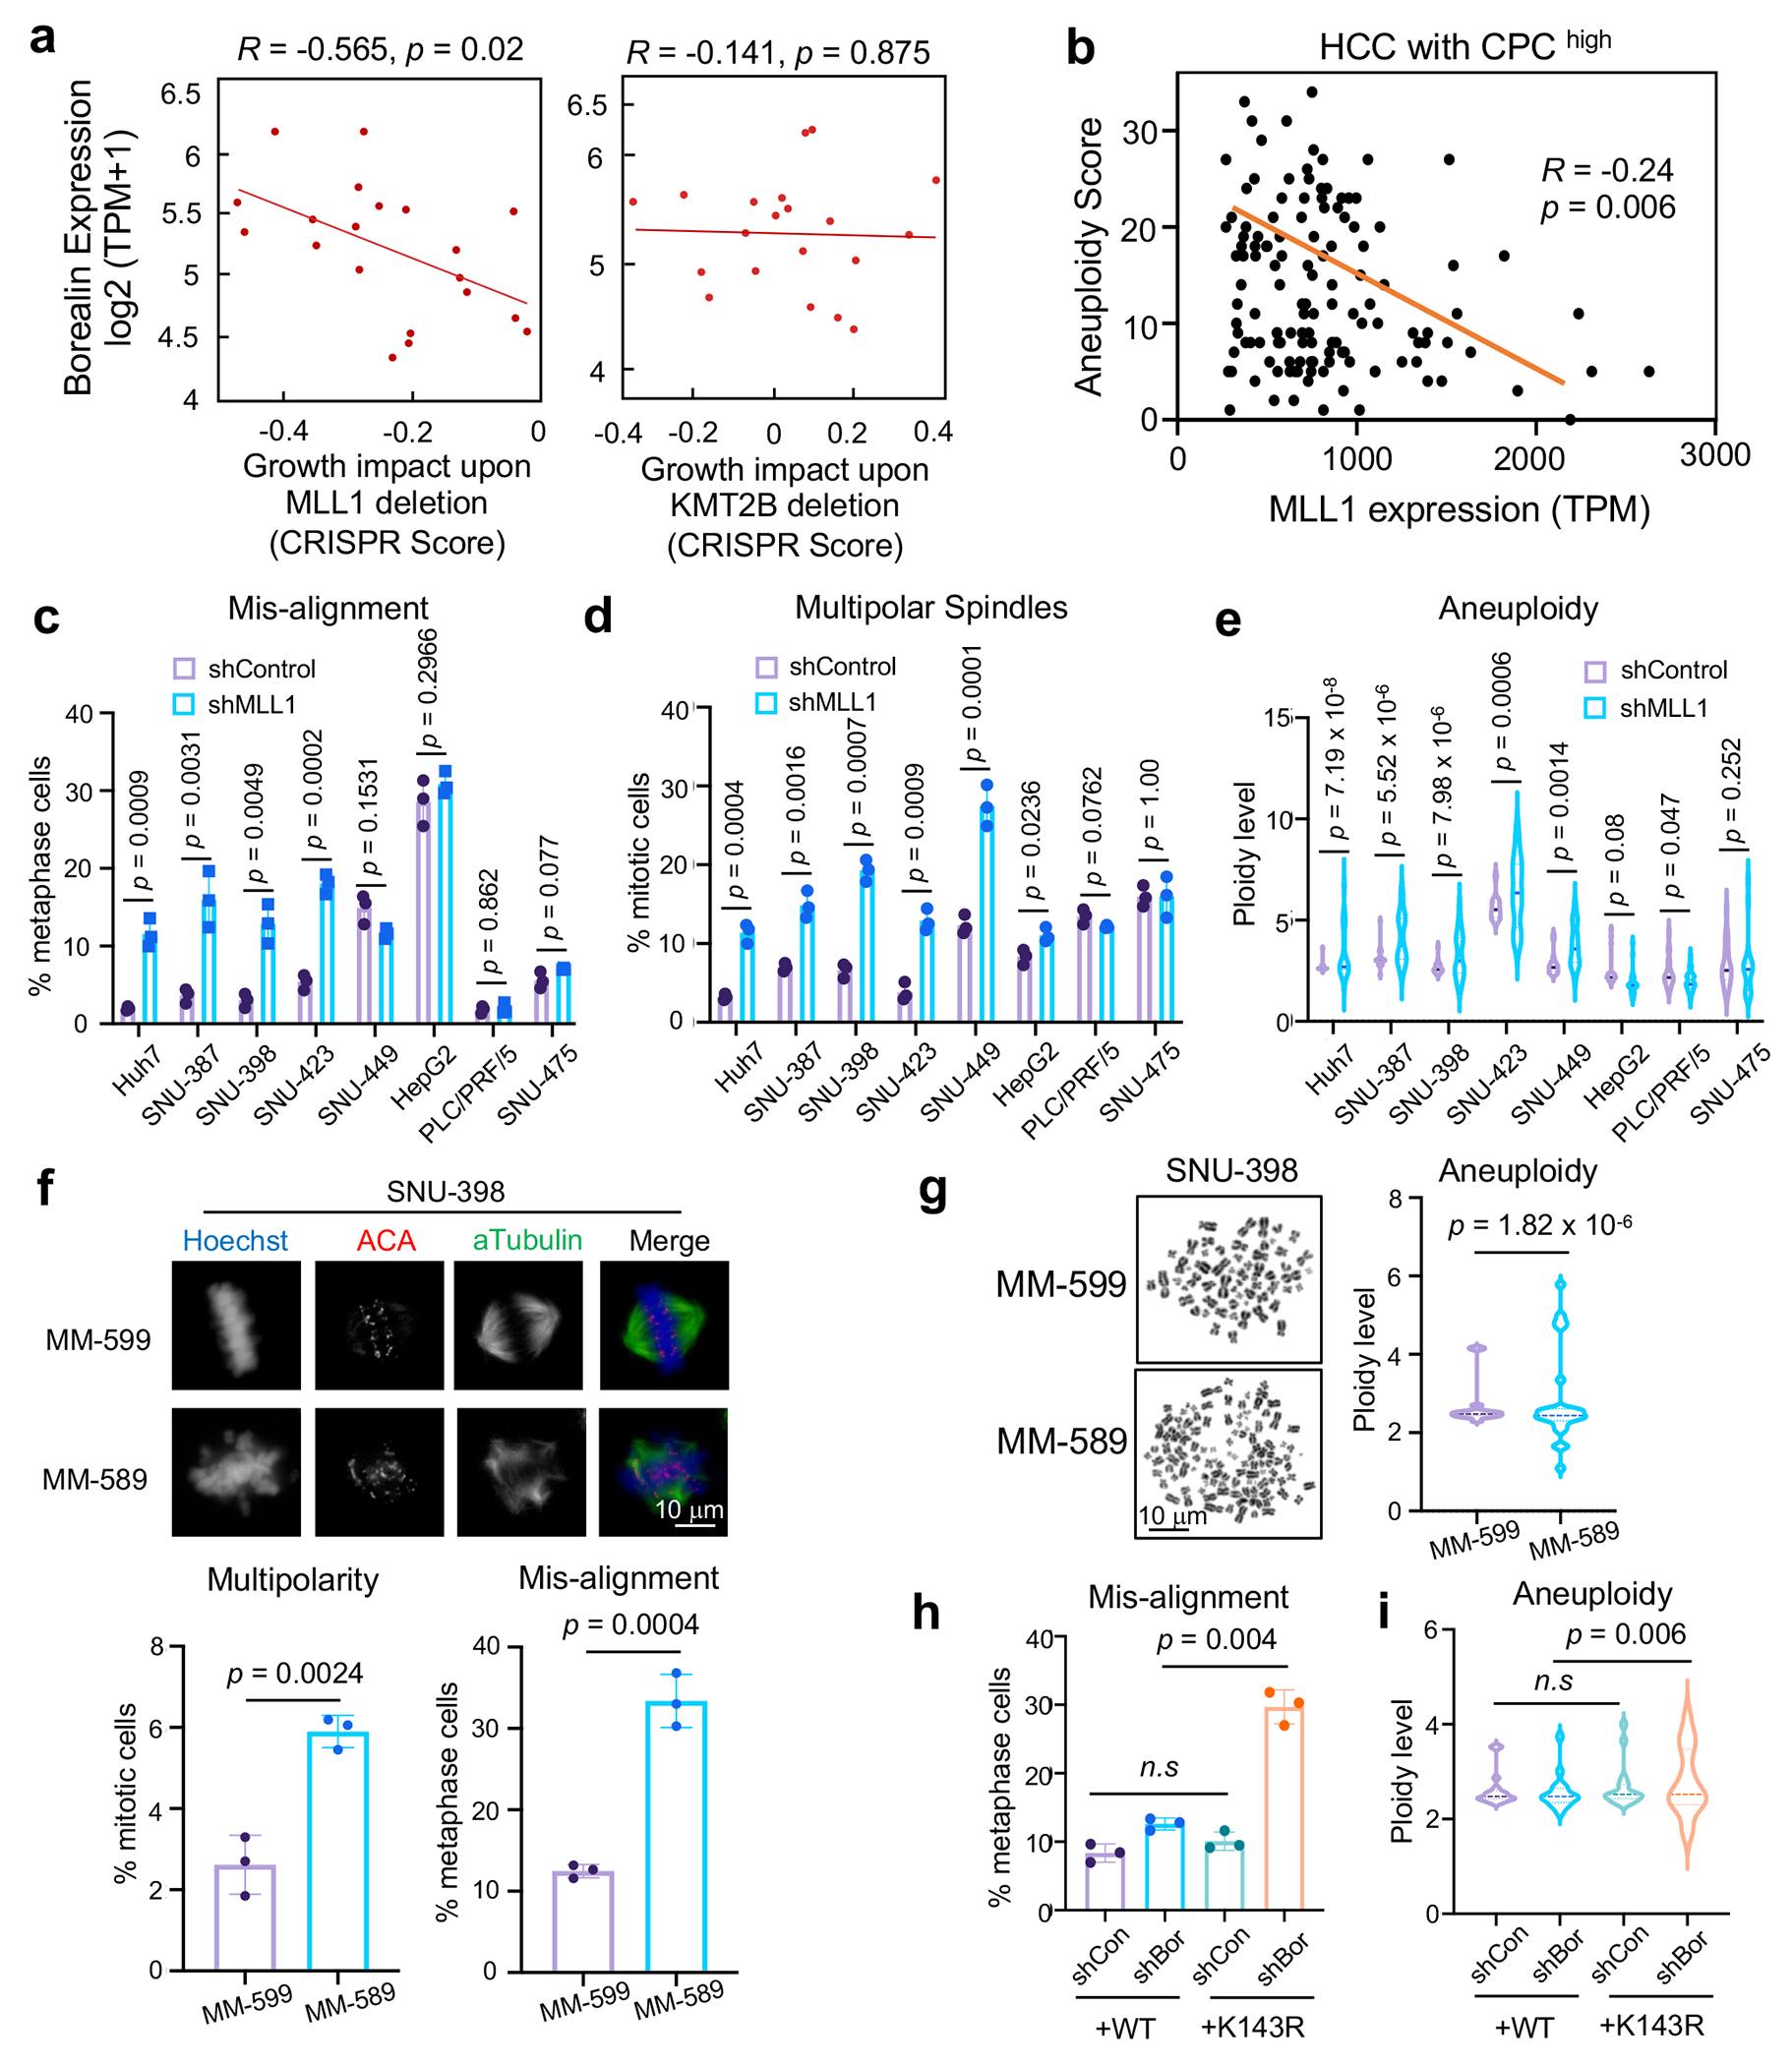
Figure 6 |. MLL1 is required to maintain genome stability in CPChigh HCC cells.

(a) Scatter plot of MLL1 (left) or KMT2B (right) dependency score vs. Borealin expression level in 20 HCC cell lines. Correlation coefficient (R) and p-values were determined by Spearman’s rank test and linear regression, respectively. X-axis, gene effect refers to growth upon deletion. Lower score means more deleterious effects on growth.
(b) Scatter plot of MLL1 expression and aneuploidy scores of HCC tumors from TCGA HCC cohort with high CPC expression (n = 196/380). Pearson correlation was performed to calculate R and p value (two-tailed).
(c-d) Percentages of metaphase cells with DNA misalignment (c) and multipolar spindles (d) for eight human HCC cell lines after control or MLL1 shRNA treatment.
(e) DNA ploidy from eight HCC cell lines treated with control or MLL1 shRNA.
(f) Immunofluorescence for ACA and αTubulin in SNU-398 cells treated with indicated compounds. DNA was visualized with Hoechst. Representative images from three independent experiments were presented. Scale bar, 10 μm. Quantification of multipolar spindles or DNA misalignment is shown on bottom.
(g) Left, representative mitotic spreads from SNU-398 cells treated with indicated compounds. Scale bar, 10 μm. Right, DNA ploidy were quantified as multiples of 23.
(h-i) Quantification of mitotic chromosome mis-alignment (h) and DNA ploidy (i) in SNU-398 cells ectopically expressing Borealin WT or K143R and treated with indicated shRNAs.
For (c-d), (f), and (h), at least 120 total cells were analyzed for each condition per experiment. Average and standard deviation (error bars) from 3 independent experiments were presented. Two-tailed unpaired Student’s t-test was performed to calculate the p-values. n.s, p > 0.05.
For (e), (g) and (i), DNA ploidy is shown as multiple of 23 (set as 1). Twenty-five cells (e), sixteen cells (g) and thirty cells (i) were scored for each condition per experiment, respectively. The central lines in the violin plot indicate mean values. Top and bottom dashed lines represent 75% and 25% quantiles, respectively. Representative results from two independent experiments were shown. The p-value was calculated using one-sided F-test. n.s, p > 0.05.
